Fig. 11
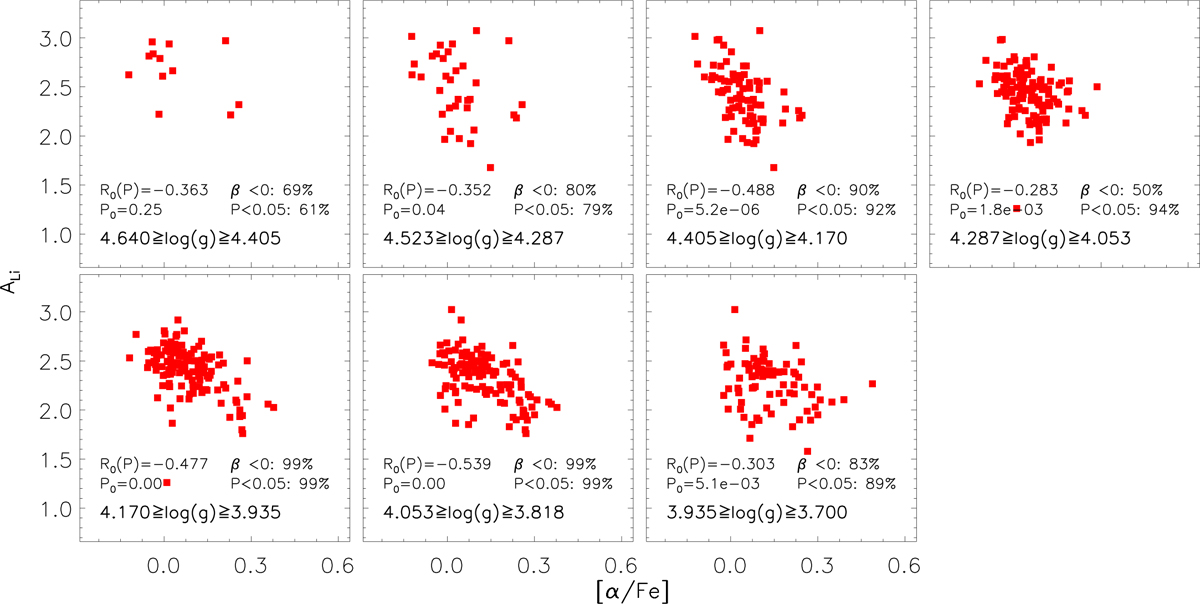
NLTE Li abundance as a function of [α/Fe] in each log(g) bin for our sample stars with Li measurements. The range of log(g) is specified in each plot, with bin size of 0.235 dex. We label the mean correlation coefficient (R0 (P)) between ALi and [α/Fe], the mean correlation significance level (P0), the possibility of Li-[α/Fe] anticorrelation (β < 0) if consider the abundance uncertainties, and the possibility of P < 0.05 for the anticorrelation.
Current usage metrics show cumulative count of Article Views (full-text article views including HTML views, PDF and ePub downloads, according to the available data) and Abstracts Views on Vision4Press platform.
Data correspond to usage on the plateform after 2015. The current usage metrics is available 48-96 hours after online publication and is updated daily on week days.
Initial download of the metrics may take a while.