Fig. 7
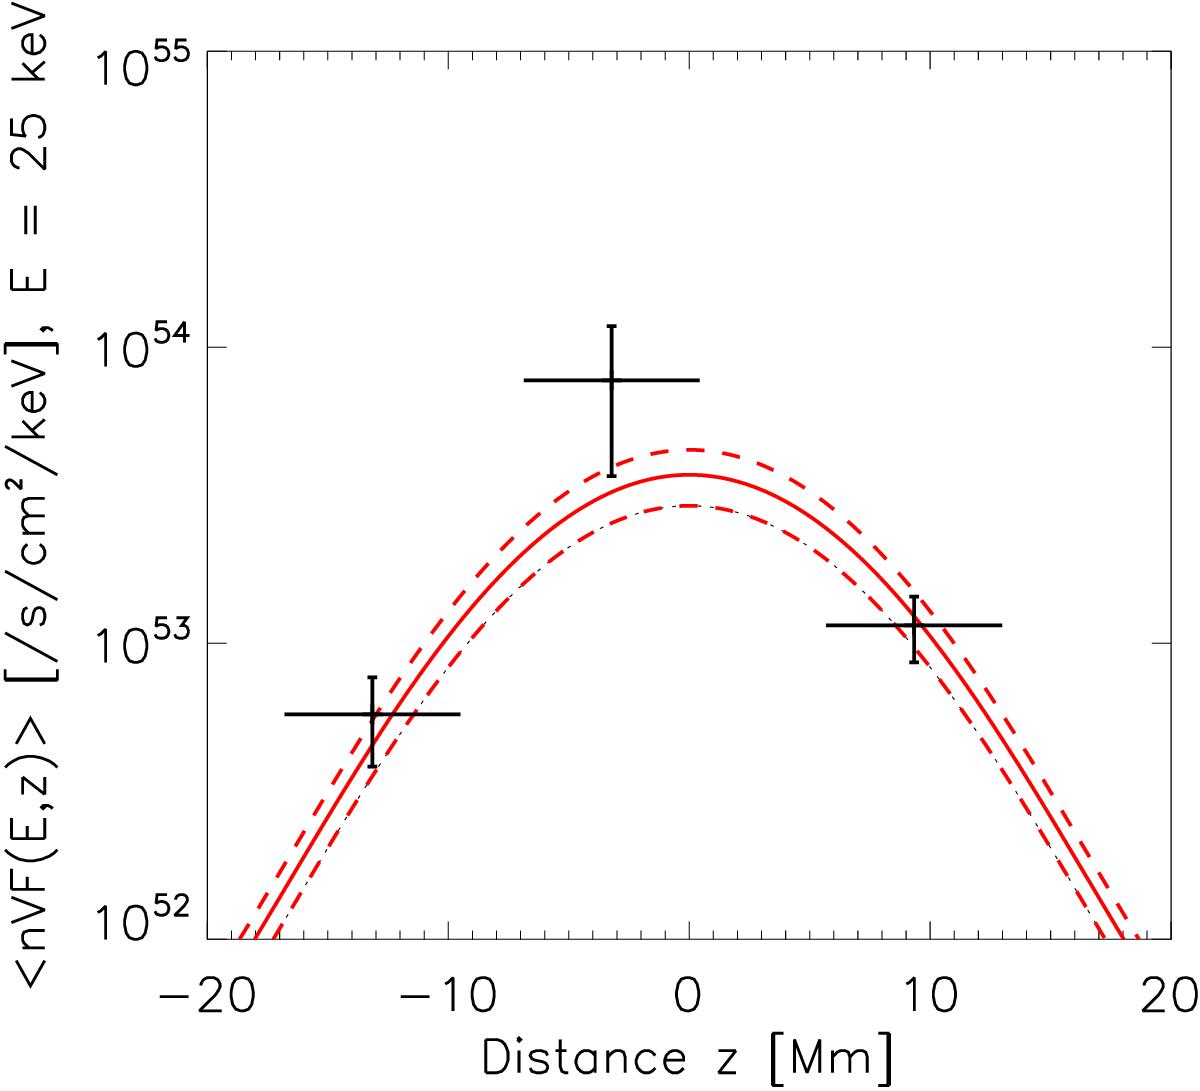
Spatial distribution of energetic electrons at 25 keV deduced from X-ray observations (black crosses) and computed with the diffusive transport model of Kontar et al. (2014) with n = 9.5 × 1010 cm-3, d = 5.5 Mm and λ = 1.4 × 108 cm (red lines). The looptop source is shifted of 3.2 Mm in regards to the top of the loop, as described in Kuznetsov & Kontar (2015). For the model, the dashed or dotted lines indicate a confidence interval around the computed value shown by the plain line. A detailed description is provided in Sect. 4.1.
Current usage metrics show cumulative count of Article Views (full-text article views including HTML views, PDF and ePub downloads, according to the available data) and Abstracts Views on Vision4Press platform.
Data correspond to usage on the plateform after 2015. The current usage metrics is available 48-96 hours after online publication and is updated daily on week days.
Initial download of the metrics may take a while.