Fig. 6
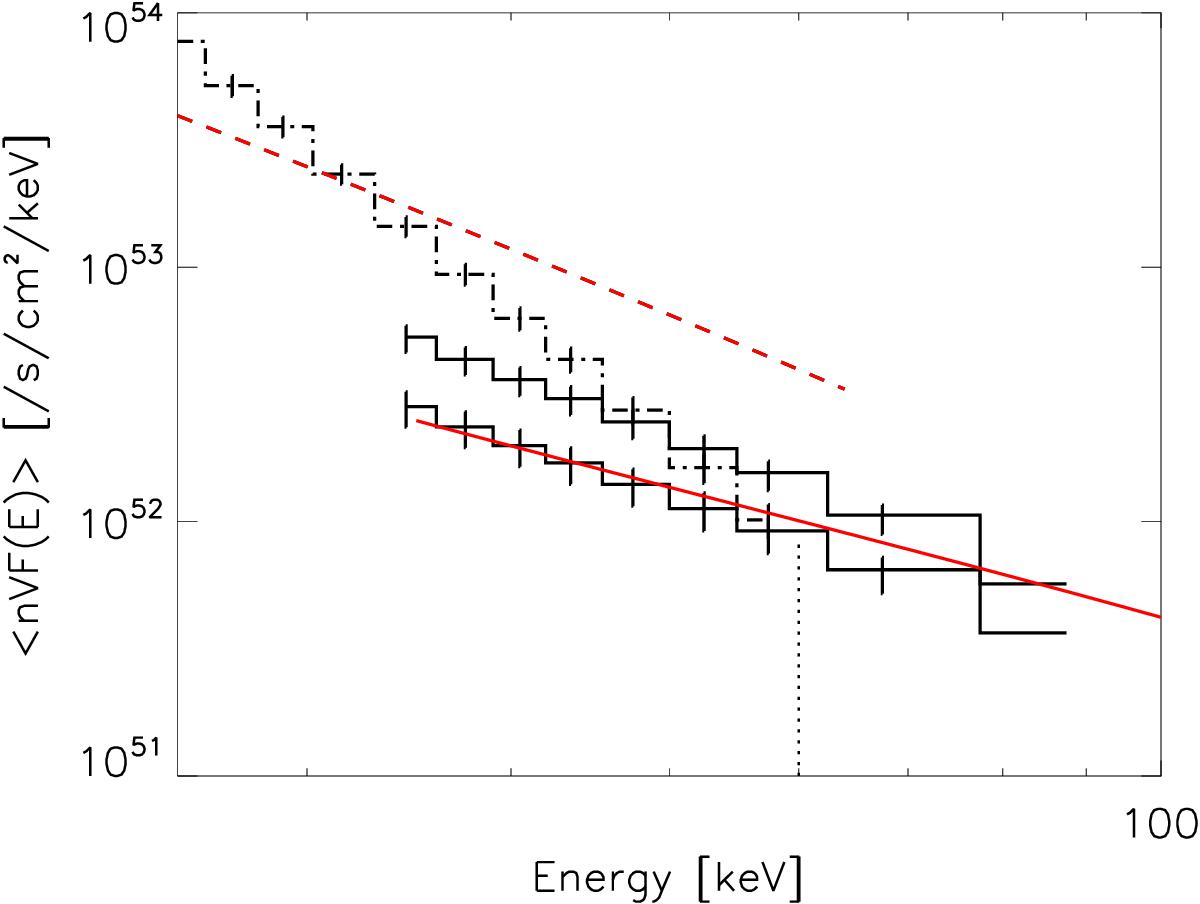
Spatially integrated and density weighted mean flux spectra for looptop (dashed line) and footpoint sources (plain lines) deduced from X-ray observations (black histograms), and computed with the diffusive transport of Kontar et al. (2014) model with n = 9.5 × 1010 cm-3, d = 5.5 Mm, and λ = 1.4 × 108 cm (red). The dotted vertical line indicates the energy at which the coronal and second footpoint spectra cross.
Current usage metrics show cumulative count of Article Views (full-text article views including HTML views, PDF and ePub downloads, according to the available data) and Abstracts Views on Vision4Press platform.
Data correspond to usage on the plateform after 2015. The current usage metrics is available 48-96 hours after online publication and is updated daily on week days.
Initial download of the metrics may take a while.