Fig. 4
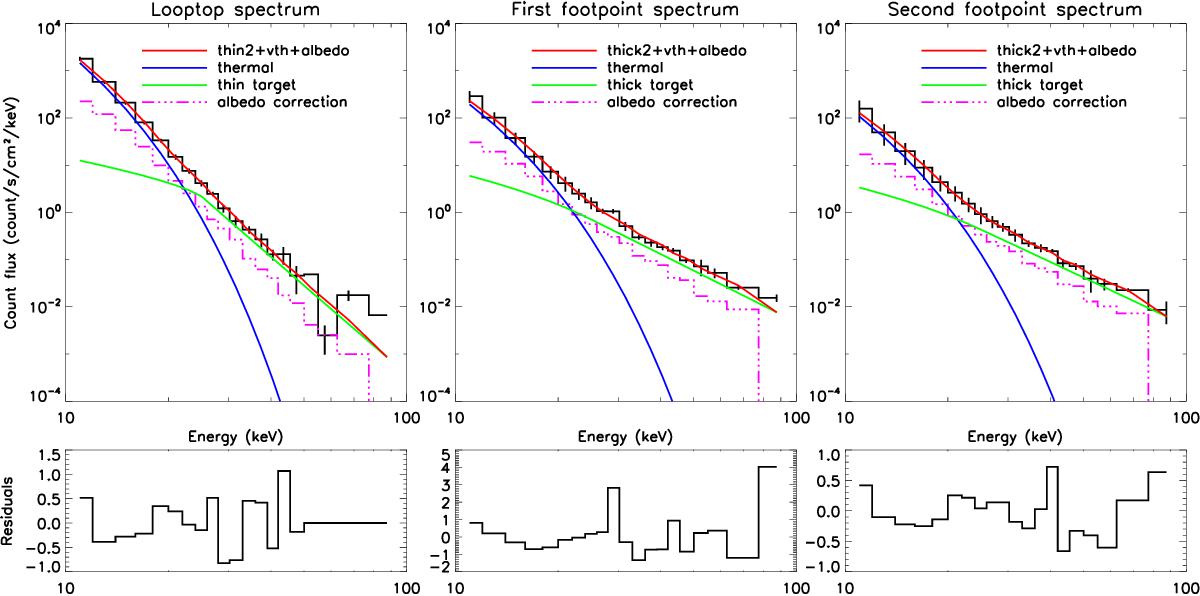
Count flux spectra (data and fit) with residuals for looptop source (left), first footpoint (middle), and second footpoints (right), as defined by the black boxes in Fig. 2. The spectra derived from the data are shown in black. The blue curve represents the thermal component of the fit and the green curve represents the non-thermal component. The pink dash-dotted line represents the component due to albedo correction. The red curve indicates the total fitted spectrum.
Current usage metrics show cumulative count of Article Views (full-text article views including HTML views, PDF and ePub downloads, according to the available data) and Abstracts Views on Vision4Press platform.
Data correspond to usage on the plateform after 2015. The current usage metrics is available 48-96 hours after online publication and is updated daily on week days.
Initial download of the metrics may take a while.