Fig. 3
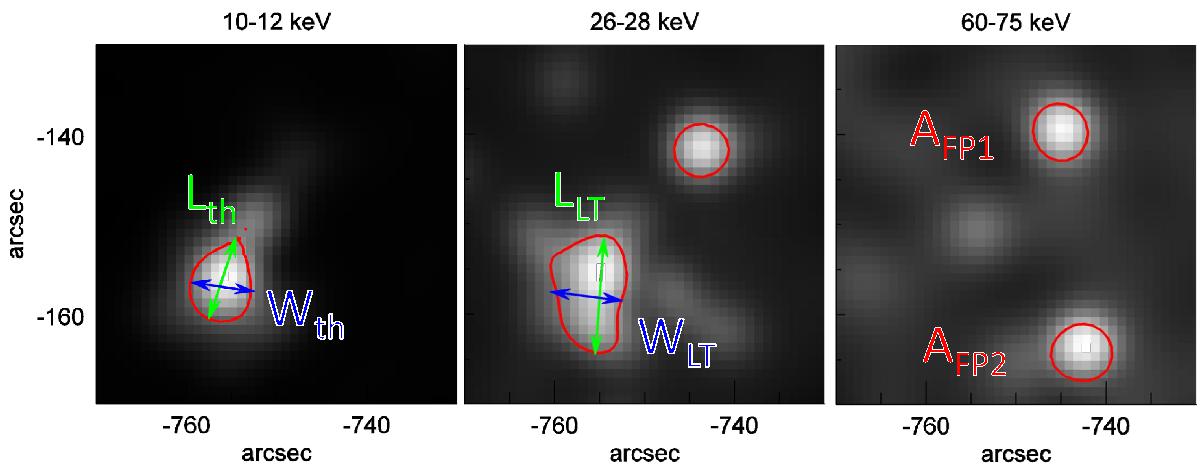
RHESSI images in 3 of the 20 energy bins used for imaging spectroscopy, integrated between 23:49:30 and 23:50:30 UT with 50% of the maximum value encircled in red. Source lengths and widths are shown with green and blue arrows, respectively. At 10–12 keV, the X-ray emission is thermal and we therefore show the length and width of the thermal source Lth and Wth. At 26–28 keV, the emission is non-thermal and we therefore show the length and width of the non-thermal looptop source LLT and WLT. At 60–75 keV, the area of the footpoint sources is calculated with the 50% contour in red.
Current usage metrics show cumulative count of Article Views (full-text article views including HTML views, PDF and ePub downloads, according to the available data) and Abstracts Views on Vision4Press platform.
Data correspond to usage on the plateform after 2015. The current usage metrics is available 48-96 hours after online publication and is updated daily on week days.
Initial download of the metrics may take a while.