Fig. 3
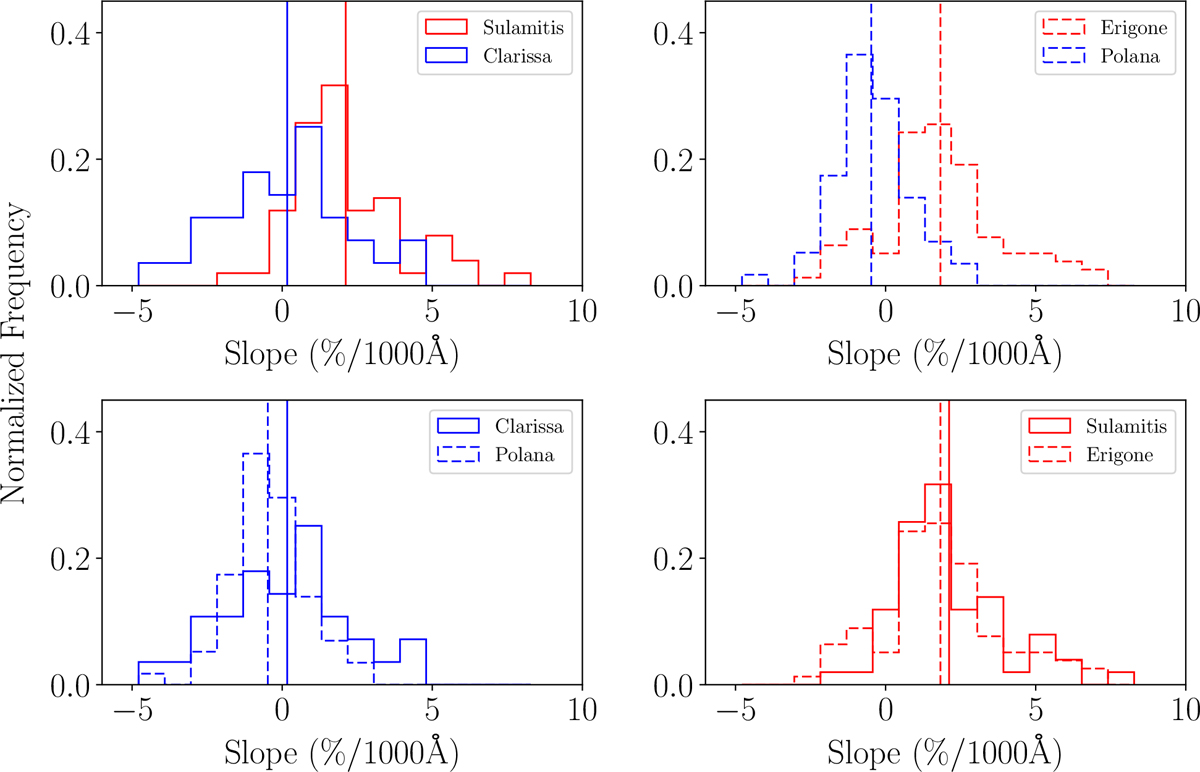
Comparison of the spectral slope distributions of the primitive families in the inner main belt. The bin size is 0.87%/1000 Å. From left to right, top to bottom: sulamitis vs. Clarissa (this work), Polana vs. Erigone (the largest families, see Morate et al. 2016 for in-depth results), Clarissa vs. Polana, and Sulamitis vs. Erigone. Sulamitis and Erigone have been depicted in red, and Clarissa and Polana in blue. The vertical lines represent the mean values of the slope distributions. See text for more details.
Current usage metrics show cumulative count of Article Views (full-text article views including HTML views, PDF and ePub downloads, according to the available data) and Abstracts Views on Vision4Press platform.
Data correspond to usage on the plateform after 2015. The current usage metrics is available 48-96 hours after online publication and is updated daily on week days.
Initial download of the metrics may take a while.