Fig. 8
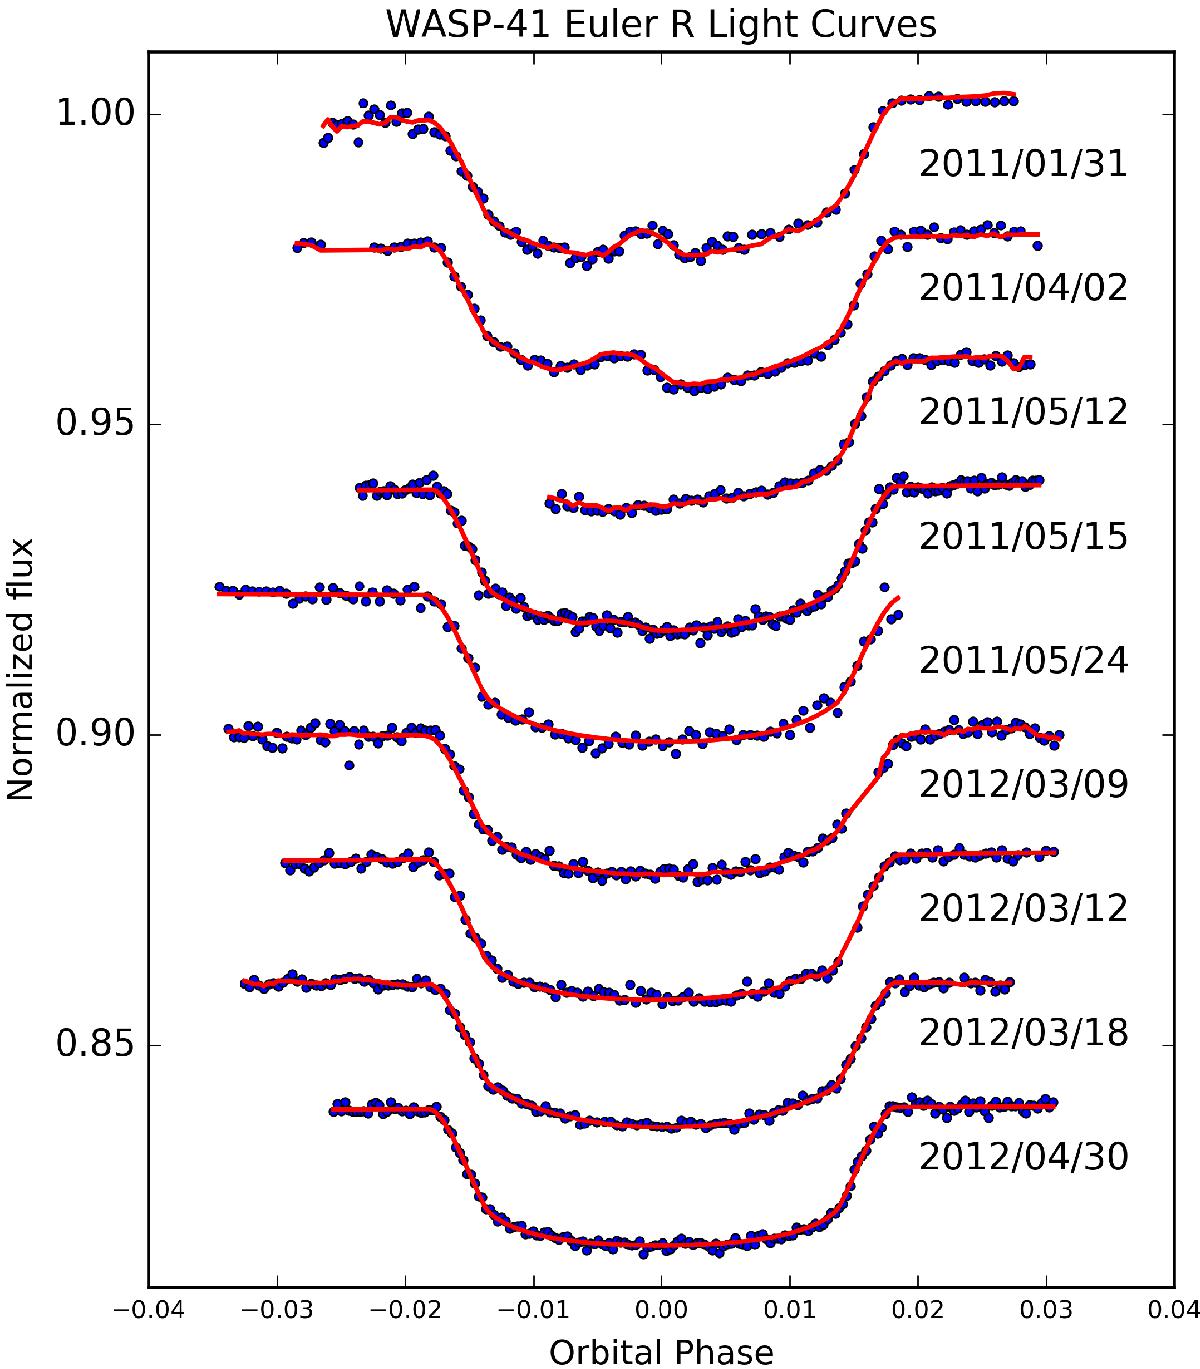
EulerCam light curves (blue dots) and best-fit models (red line) with the corresponding residuals shown in Fig. 9. The TLCs are presented with their respective date of observation. We note that the light curves with observing dates 2011/01/31, 2011/04/02, and 2011/05/15 were modeled with an occulted starspot feature. Results obtained from the simultaneous analysis are given in Tables B.5 and B.6, and the derived spot parameters from the simultaneous and individual analysis are presented in Tables B.7 and B.8.
Current usage metrics show cumulative count of Article Views (full-text article views including HTML views, PDF and ePub downloads, according to the available data) and Abstracts Views on Vision4Press platform.
Data correspond to usage on the plateform after 2015. The current usage metrics is available 48-96 hours after online publication and is updated daily on week days.
Initial download of the metrics may take a while.