Fig. 5
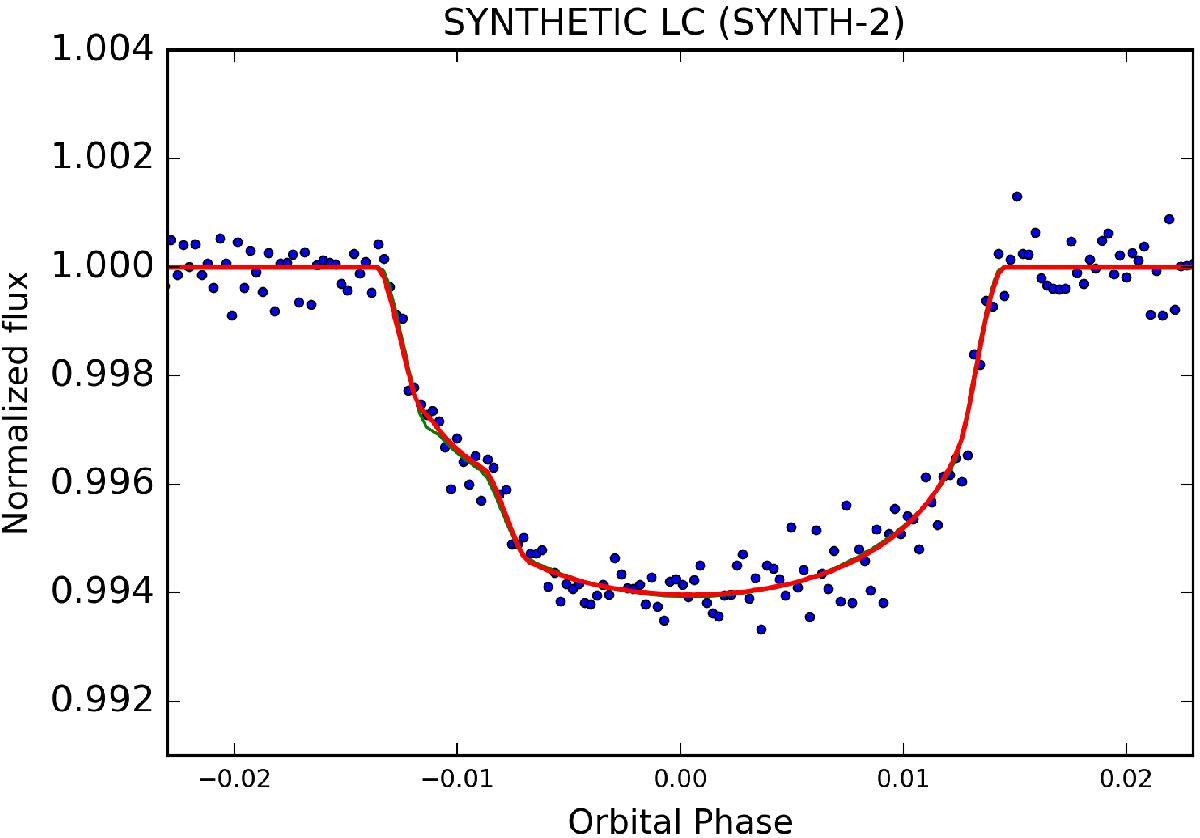
Synthetic light curve SYNTH-2a (blue dots), with the derived best-fit model (red line) and the original light curve model (green line). This synthetic light curve shows a starspot crossing at the limb of the star around phase −0.01. The obtained photometric properties and spot parameters can be found in Tables B.1 and B.3. The (O−C) residuals and the difference between the original and best-fit TLC models are shown in Fig. A.2.
Current usage metrics show cumulative count of Article Views (full-text article views including HTML views, PDF and ePub downloads, according to the available data) and Abstracts Views on Vision4Press platform.
Data correspond to usage on the plateform after 2015. The current usage metrics is available 48-96 hours after online publication and is updated daily on week days.
Initial download of the metrics may take a while.