Fig. 16
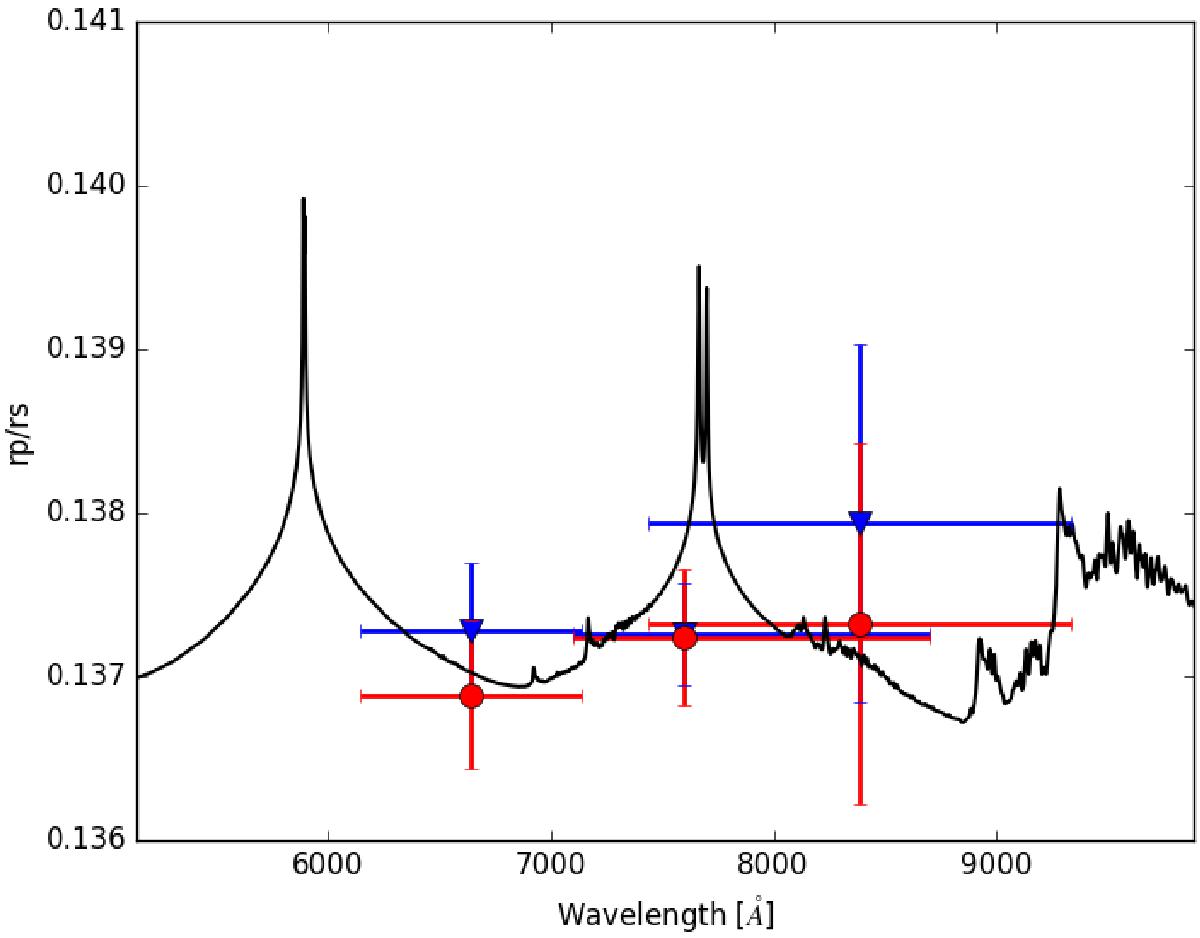
Transmission spectrum obtained from the simultaneous light curve analyses for two cases: the blue triangles show the radius ratios with their respective uncertainties from the analysis of all light curves assuming a spot-free model. The red circles present the radius ratios and uncertainties obtained through the analysis of all TLCs, taking starspots into account. We remark that for both scenarios, we excluded the TRAPPIST (2011/03/21) light curve from the analysis.
Current usage metrics show cumulative count of Article Views (full-text article views including HTML views, PDF and ePub downloads, according to the available data) and Abstracts Views on Vision4Press platform.
Data correspond to usage on the plateform after 2015. The current usage metrics is available 48-96 hours after online publication and is updated daily on week days.
Initial download of the metrics may take a while.