Fig. 14
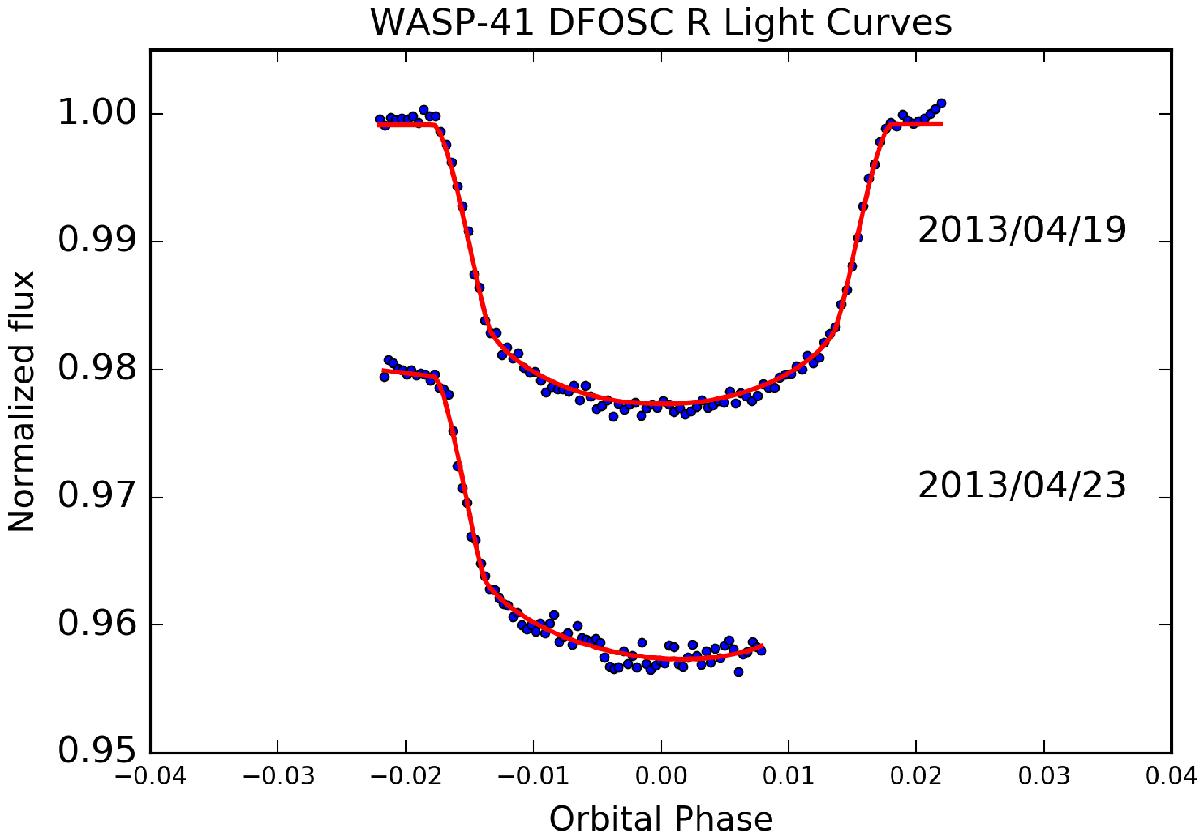
DFOSC R light curves (blue dots) and obtained best-fit models (red line) with the corresponding residuals shown in Fig. 15. On the right hand side, we indicated the corresponding observing dates. We note that only one of the light curves shows a full transit event. Results obtained from the simultaneous analysis are given in Tables B.5 and B.6.
Current usage metrics show cumulative count of Article Views (full-text article views including HTML views, PDF and ePub downloads, according to the available data) and Abstracts Views on Vision4Press platform.
Data correspond to usage on the plateform after 2015. The current usage metrics is available 48-96 hours after online publication and is updated daily on week days.
Initial download of the metrics may take a while.