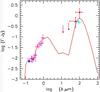
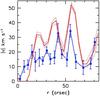
Fig. 7
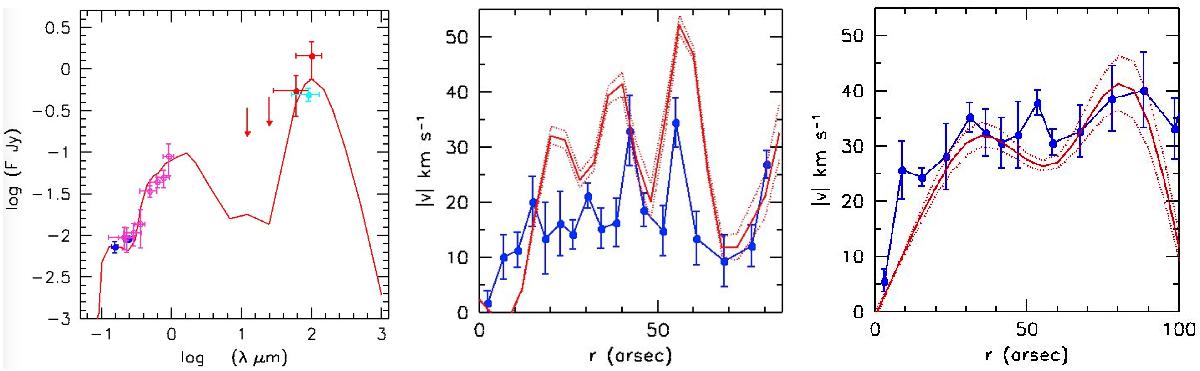
Left: measured (filled dots) and predicted (red solid line) SED of the NGC 3447A/NGC 3447 system; blue, magenta, red, and azure dots indicate far-UV GALEX, from Marino et al. (2010), Swift-UVOT and SDSS (Tables 1 and 2), IRAS and AKARI-F (Catalog Archive Server, Yamauchi et al. 2011) data, respectively. Middle and right: comparison between the observed velocity profiles along the directions in Fig. 4, PA = 14.3° (middle) and PA = 65° (right), with those derived from the selected snapshot in the corresponding directions and within the same semi-angle sector (i.e. 25°). The velocity profiles are folded and rebinned within 5′′ (blue filled dots) to be compared with the same slices of the simulation (red solid and dotted lines), with the same binning.
Current usage metrics show cumulative count of Article Views (full-text article views including HTML views, PDF and ePub downloads, according to the available data) and Abstracts Views on Vision4Press platform.
Data correspond to usage on the plateform after 2015. The current usage metrics is available 48-96 hours after online publication and is updated daily on week days.
Initial download of the metrics may take a while.