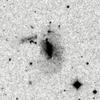
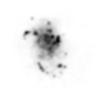
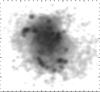
Fig. 6

Comparison between the B-band DSS image from NED, 7′ × 7′, left panel, and the B-band luminosity density maps (XY projection) from the snapshot best fitting the global properties of NGC 3447A/NGC 3447 normalised to the total flux in the box (middle and right panels); maps are on the same spatial scale, and resolution (1.̋7), and with different density contrast, 200 (middle) and 1500 (right).
Current usage metrics show cumulative count of Article Views (full-text article views including HTML views, PDF and ePub downloads, according to the available data) and Abstracts Views on Vision4Press platform.
Data correspond to usage on the plateform after 2015. The current usage metrics is available 48-96 hours after online publication and is updated daily on week days.
Initial download of the metrics may take a while.