Fig. 3
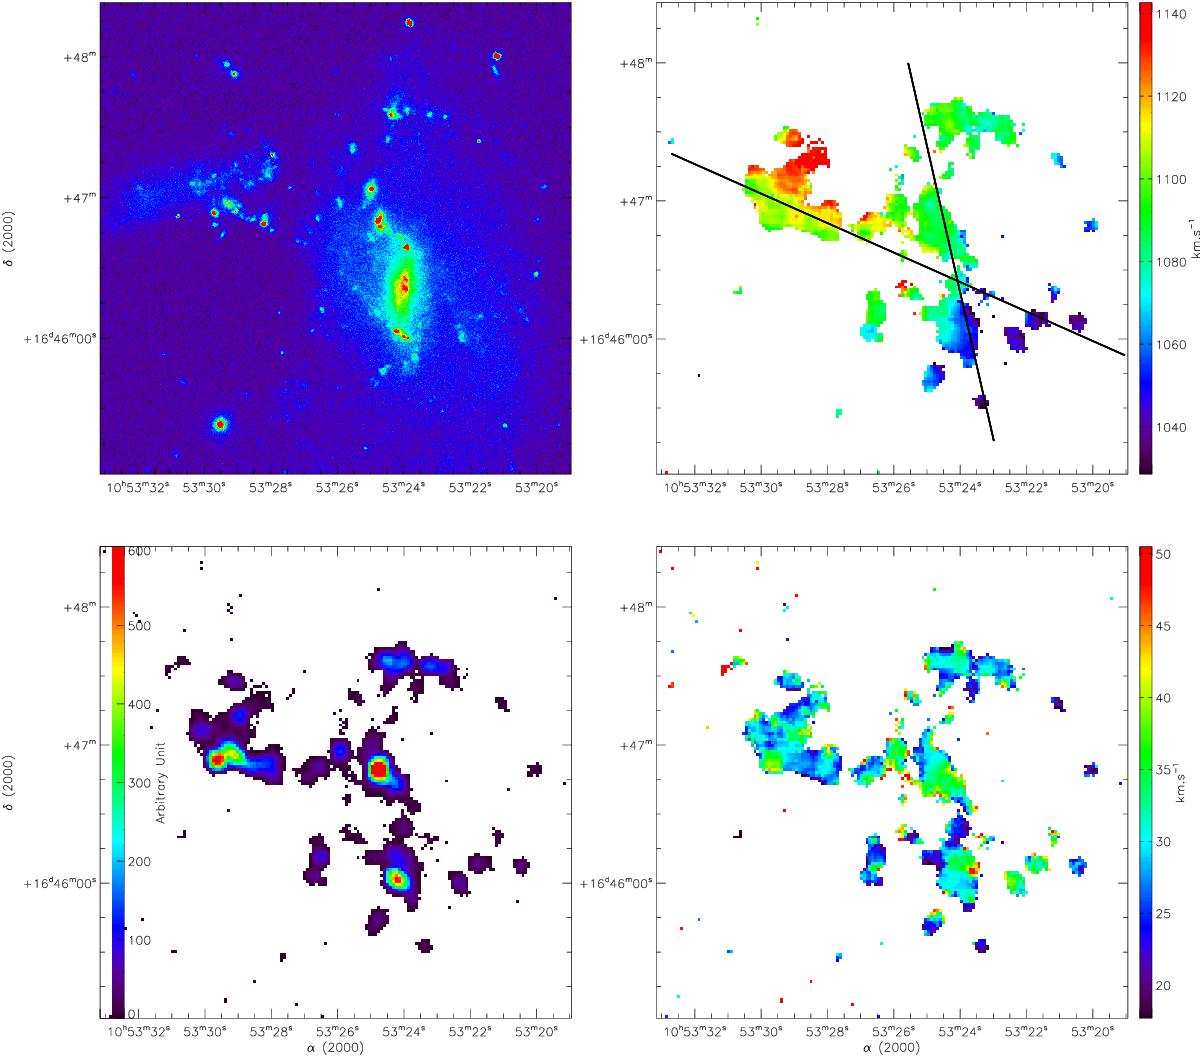
Top: SDSS r-band image of NGC 3447/3447A (left) and the velocity field of Hα emission (right). Bottom: the Hα, monochromatic emission map (left) and its velocity dispersion map (right). All panels correspond to the same ![]() field, and are on the same spatial scale with North on the top and East to the left. Black solid lines in the top right panel show the position angles along which the velocity profiles, shown in Fig. 4, are derived.
field, and are on the same spatial scale with North on the top and East to the left. Black solid lines in the top right panel show the position angles along which the velocity profiles, shown in Fig. 4, are derived.
Current usage metrics show cumulative count of Article Views (full-text article views including HTML views, PDF and ePub downloads, according to the available data) and Abstracts Views on Vision4Press platform.
Data correspond to usage on the plateform after 2015. The current usage metrics is available 48-96 hours after online publication and is updated daily on week days.
Initial download of the metrics may take a while.