Fig. 2
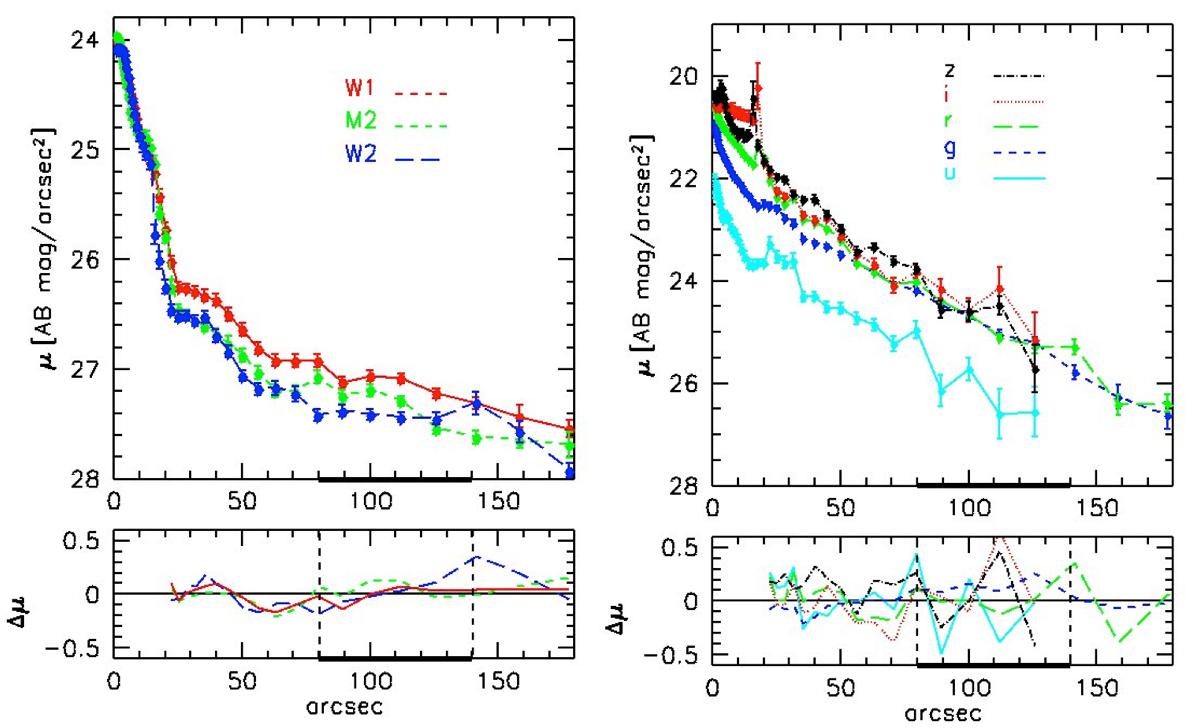
Surface-brightness profiles in the UVOT W2, M2 and W1 bands (left) and SDSS, u, g, r, i, and z (right). All the profiles include NGC 3447A, extending from 80′′ to 140′′, as emphasised (bold) in the figure. The Sérsic fit of all the profiles provides n = 1.4. The model has been subtracted from the original profile and the residuals are shown in the bottom panels. The spike arising at 18′′, from r- to z-bands, corresponds to the bright Hα region North of the bar. Profiles are not corrected for galactic extinction and truncated when the error bars exceed 0.5 mag.
Current usage metrics show cumulative count of Article Views (full-text article views including HTML views, PDF and ePub downloads, according to the available data) and Abstracts Views on Vision4Press platform.
Data correspond to usage on the plateform after 2015. The current usage metrics is available 48-96 hours after online publication and is updated daily on week days.
Initial download of the metrics may take a while.