Fig. A.2
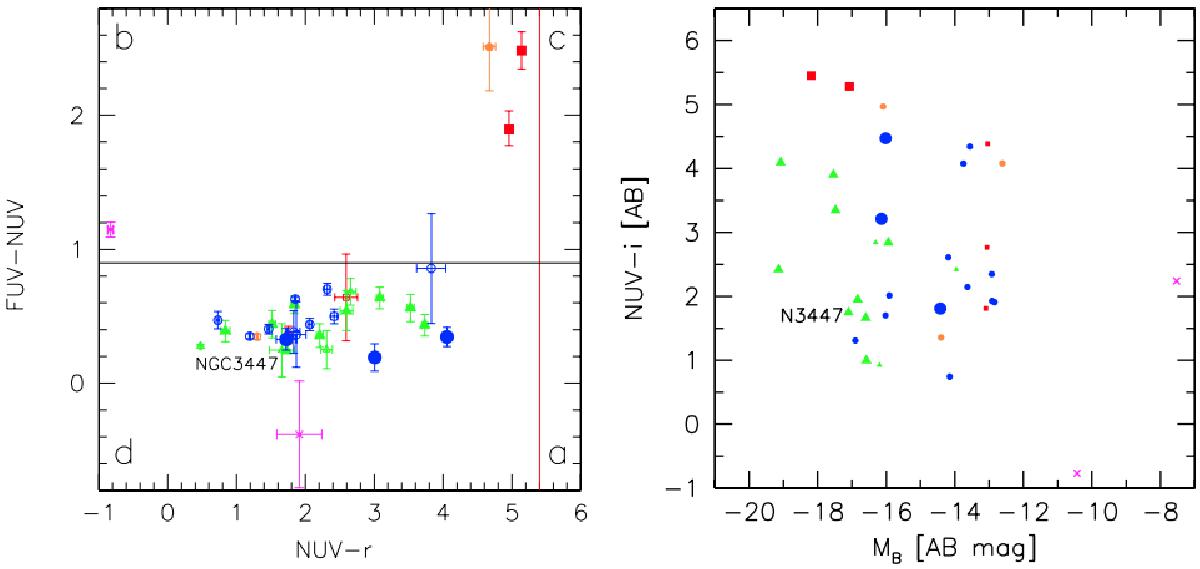
Colour–colour diagram, NUV − r vs. FUV−NUV (left panel) and the colour–magnitude diagram, MB vs. NUV − i (right panel), for all the LGG 225 members; (red) squares indicate ETGs (T ≤ −2), (orange) diamonds S0s (− 2 >T ≤ 0), (green) triangles Spirals (T< 9), (blue) circles show Irregulars (T ≥ 9) and magenta crosses are for galaxies without morphological classification in the Hyperleda catalogue; small dots are for new members of this works (Table A.2). Solid lines (left) correspond to the conditions FUV − NUV< 0.9, that is, UV rising slope, and NUV − r> 5.4 shows the region of young massive star-free galaxies. These conditions, following the UV classification scheme by Yi et al. (2011), separate passive evolving ETGs (region c) from star forming galaxies (region a), see text. In both panels magnitudes were corrected by galactic extinction following Burstein & Heiles (1982).
Current usage metrics show cumulative count of Article Views (full-text article views including HTML views, PDF and ePub downloads, according to the available data) and Abstracts Views on Vision4Press platform.
Data correspond to usage on the plateform after 2015. The current usage metrics is available 48-96 hours after online publication and is updated daily on week days.
Initial download of the metrics may take a while.