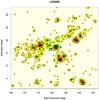
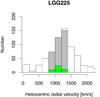
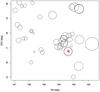
Fig. A.1

Top left: spatial distribution of galaxies (black plus symbols) within a box of 4 × 4 Mpc2 centred on LGG 225 (Marino et al. 2010, and Table A.1) and with velocity extent, σ, defined by the dynamical analysis. Blue square symbols show the members of the group in Marino et al. (2010), green diamonds indicate the added members, and the big red filled diamond marks the position of NGC 3447/NGC 3447A. The 2D binned kernel-smoothed number density contours of galaxies fainter than mB = 15.5 mag (crosses) are also shown (red/yellow shaded area). Top right: histogram of the heliocentric radial velocity of all the galaxies within the same box in the left panel accounting for a velocity dispersion ±1000 km s-1 around the average velocity of the group (Table A.1). The width of the velocity bins is 200 km s-1. The filled (grey) bins show the velocity distribution of galaxies with the same velocity extent as the members of the group; the green bins account for the all the (old+new) members of the group, i.e. galaxies within a box of 1.5 × 1.5 Mpc2 centred on LGG 225 (Table A.2). Bottom: the Dressler & Shectman (1988) “bubble-plot” based on the ten nearest galaxies. The bubble size is proportional to the squared deviation of the local velocity distribution from the group velocity distribution.
Current usage metrics show cumulative count of Article Views (full-text article views including HTML views, PDF and ePub downloads, according to the available data) and Abstracts Views on Vision4Press platform.
Data correspond to usage on the plateform after 2015. The current usage metrics is available 48-96 hours after online publication and is updated daily on week days.
Initial download of the metrics may take a while.