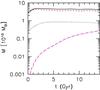
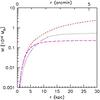
Fig. 11

Left: evolution of the different mass components within the same spherical radius of 50 kpc as in Fig. 10: (black) solid line shows the total mass, (red) short-dashed line the DM, (blue) dotted line the gas, and (magenta) long-dashed line the stellar mass. Right: the mass distribution inside a spherical radius of 30 kpc on the B-band luminous centre, at the best-fit age: (red) dashed line for the DM, (magenta) long-dashed for the stars, and (blue) dotted line for the gas component.
Current usage metrics show cumulative count of Article Views (full-text article views including HTML views, PDF and ePub downloads, according to the available data) and Abstracts Views on Vision4Press platform.
Data correspond to usage on the plateform after 2015. The current usage metrics is available 48-96 hours after online publication and is updated daily on week days.
Initial download of the metrics may take a while.