Fig. 5
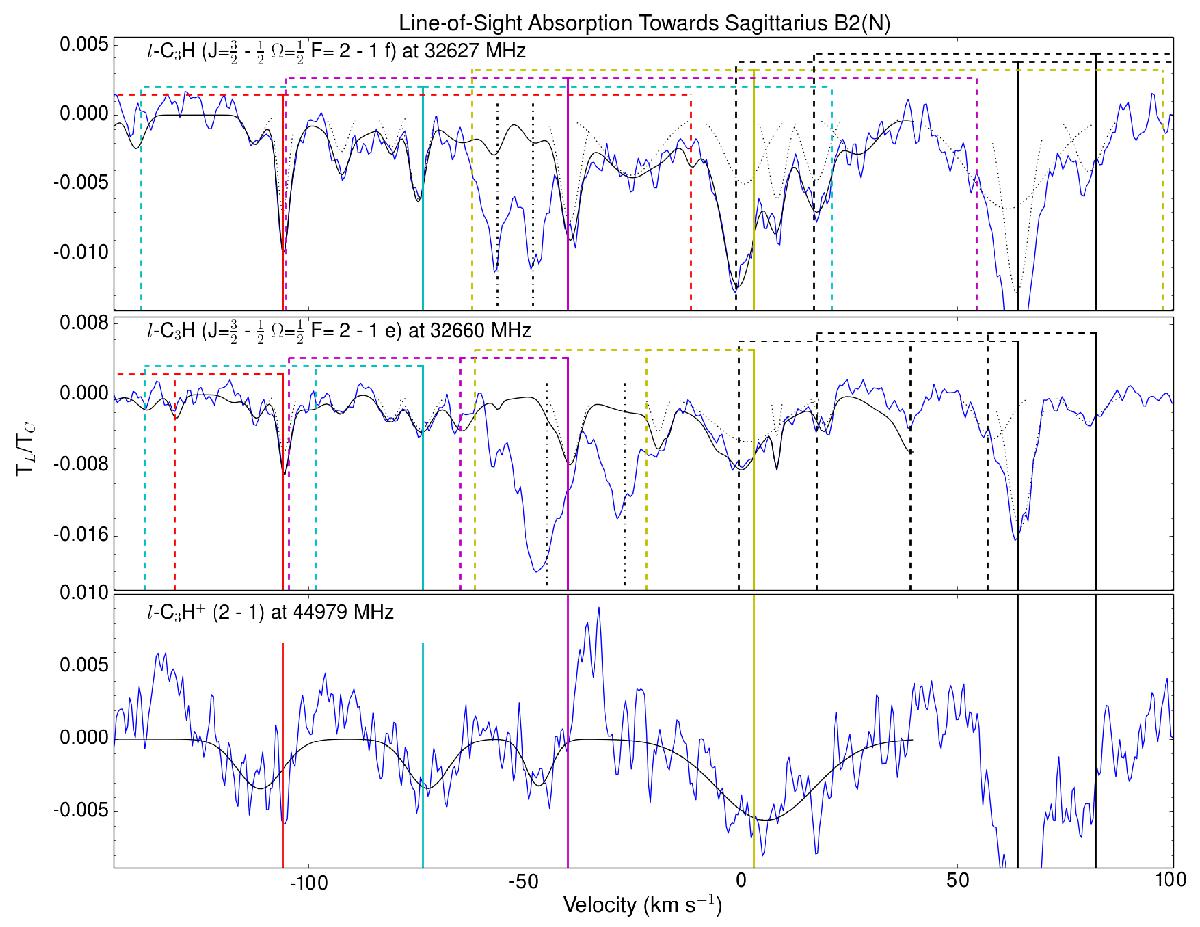
Absorption profiles of l-C3H and l-C3H+ are overlaid by the best fit Gaussian components (black dotted line) and the sum of best-fit Gaussians (black solid line). Black vertical lines indicate the velocities of line absorption by Sgr B2 at +64 and +82 km s-1, and colored lines are located at −106, −73.5, −40, and +3 km s-1. Hyperfine structure for each of these velocity components is indicated by dotted vertical lines of the same color. The data are overlaid by Gaussian components fit to the main hyperfine component shown in black dotted lines, and by the total fit to the profile, which assumes that hyperfine or A/E components are present with the same line shape as the primary component, but with the height scaled by the ratio of the line strengths. In the profile of l-C3H at 32 627 MHz, the black dashed-dotted line marks unidentified transitions that are not consistent with the typical profile of diffuse cloud absorption in this line of sight. In the line profile of l-C3H at 32 660 MHz, the black dashed-dotted line marks a transition of cis-CH2OHCHO at velocities of +64 and +82 km s-1 associated with Sgr B2.
Current usage metrics show cumulative count of Article Views (full-text article views including HTML views, PDF and ePub downloads, according to the available data) and Abstracts Views on Vision4Press platform.
Data correspond to usage on the plateform after 2015. The current usage metrics is available 48-96 hours after online publication and is updated daily on week days.
Initial download of the metrics may take a while.