Fig. 2
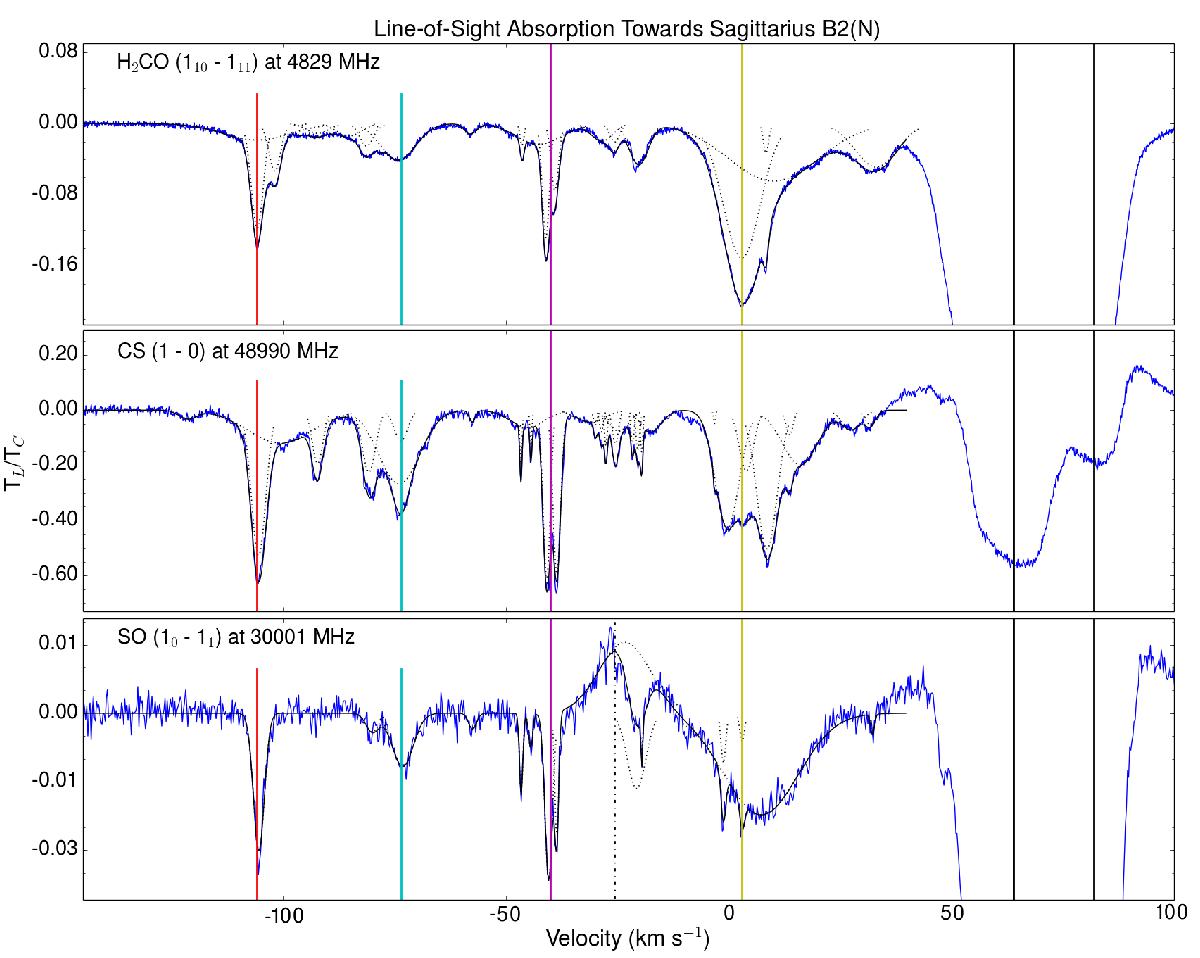
Absorption profiles of H2CO, CS, and SO are overlaid by individual best fit Gaussian components (black dotted line) and the sum of best-fit Gaussians (black solid line). Black vertical lines indicate the velocities of line absorption by Sgr B2 at +64 and +82 km s-1, and colored lines are located at −106, −73.5, −40, and +3 km s-1. In the profile of SO, the black dashed-dotted line indicates the 8![]() –8
–8![]() transition of CH3OH at +64 km s-1, which appears in emission.
transition of CH3OH at +64 km s-1, which appears in emission.
Current usage metrics show cumulative count of Article Views (full-text article views including HTML views, PDF and ePub downloads, according to the available data) and Abstracts Views on Vision4Press platform.
Data correspond to usage on the plateform after 2015. The current usage metrics is available 48-96 hours after online publication and is updated daily on week days.
Initial download of the metrics may take a while.