Fig. A.6
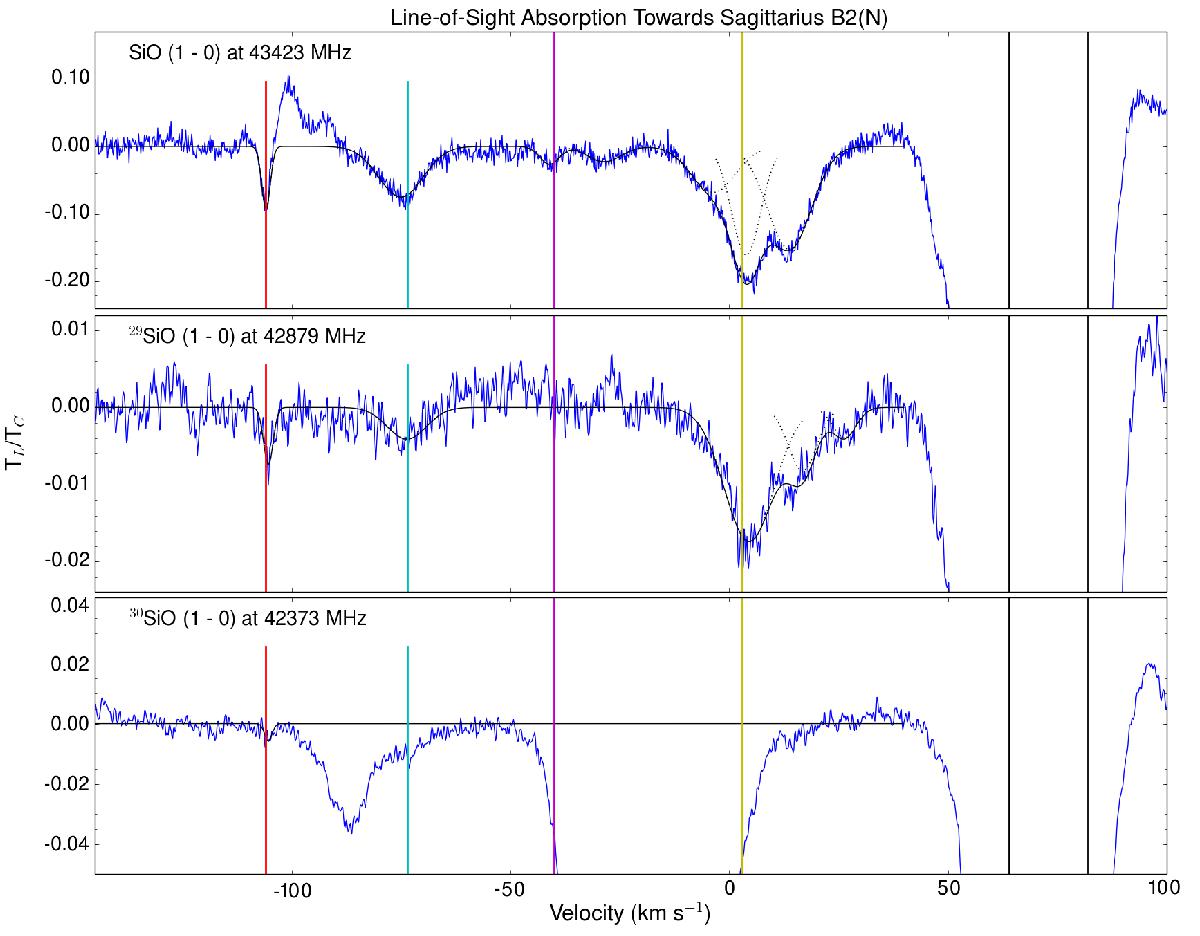
Absorption profiles of SiO isotopologues are overlaid by the best fit Gaussian components (black dotted line) and the sum of best-fit Gaussians (black solid line). Black vertical lines indicate the velocities of line absorption by Sgr B2 at +64 and +82 km s-1, and colored lines are located at −106, −73.5, −40, and +3 km s-1. The profile of 30SiO includes a single detected component at −106 km s-1 due to blending with the line-of-sight absorption profile of NH2CHO.
Current usage metrics show cumulative count of Article Views (full-text article views including HTML views, PDF and ePub downloads, according to the available data) and Abstracts Views on Vision4Press platform.
Data correspond to usage on the plateform after 2015. The current usage metrics is available 48-96 hours after online publication and is updated daily on week days.
Initial download of the metrics may take a while.