Fig. A.1
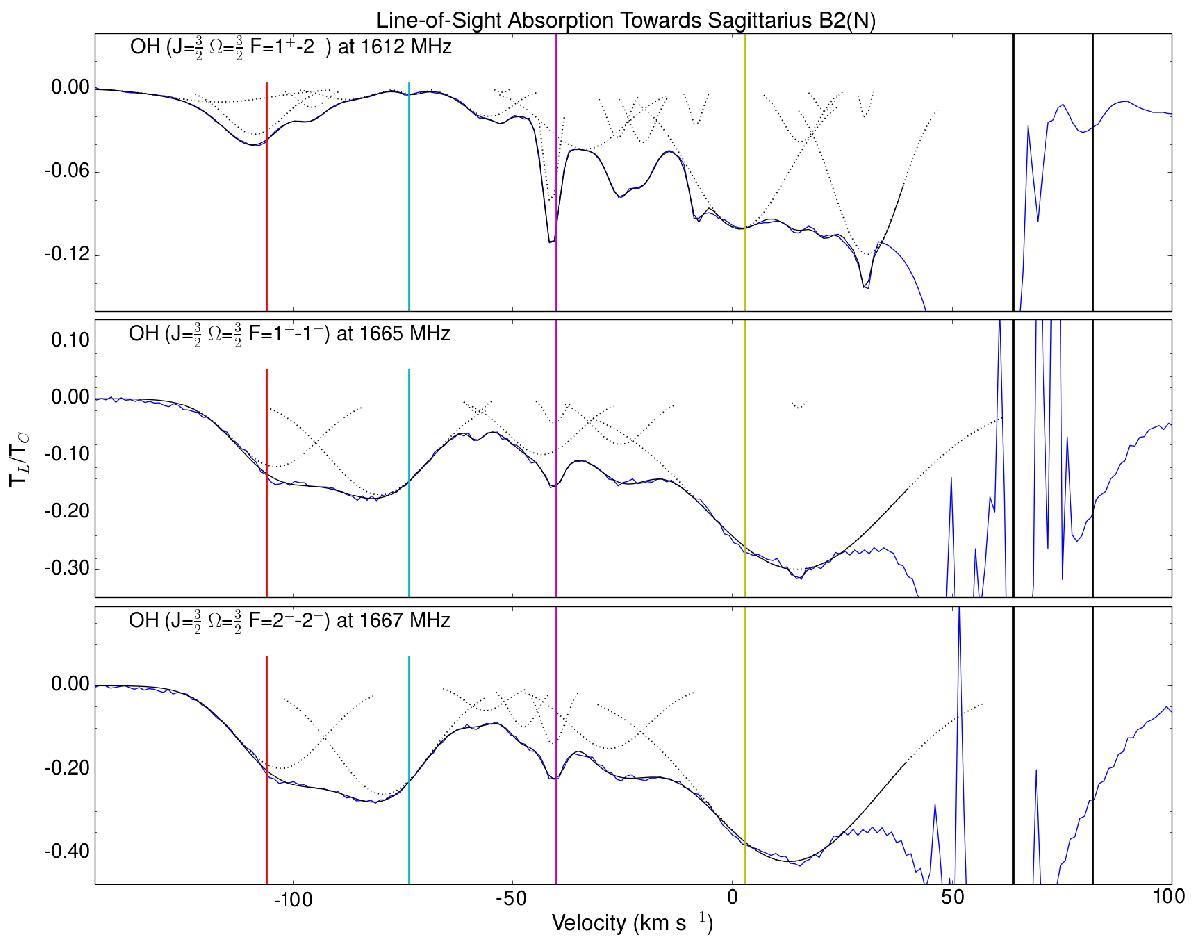
Absorption profiles of OH are shown in blue. Black vertical lines indicate the velocities of line absorption by Sgr B2 at +64 and +82 km s-1, and colored lines are located at −106, −73.5, −40, and +3 km s-1. Hyperfine or A/E structure for each of these velocity components is indicated by dotted vertical lines of the same color. The data are overlaid by individual Gaussian components fit (black dotted lines), and by the total fit to the profile (black solid line).
Current usage metrics show cumulative count of Article Views (full-text article views including HTML views, PDF and ePub downloads, according to the available data) and Abstracts Views on Vision4Press platform.
Data correspond to usage on the plateform after 2015. The current usage metrics is available 48-96 hours after online publication and is updated daily on week days.
Initial download of the metrics may take a while.