Free Access
Fig. 1
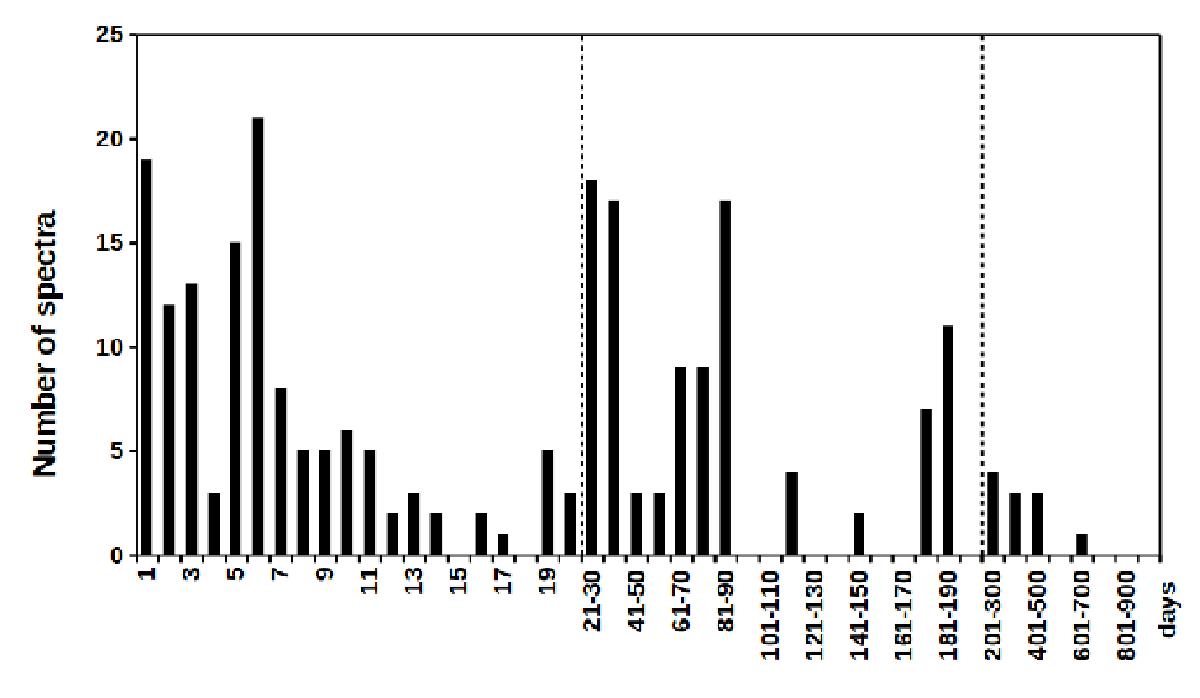
Distribution of time intervals between successive Hermes spectra for the sample stars showing peaks of 1 and 6 days as well as ~1 and ~3 months. Note the rapidly increasing bin size along the X-axis.
Current usage metrics show cumulative count of Article Views (full-text article views including HTML views, PDF and ePub downloads, according to the available data) and Abstracts Views on Vision4Press platform.
Data correspond to usage on the plateform after 2015. The current usage metrics is available 48-96 hours after online publication and is updated daily on week days.
Initial download of the metrics may take a while.