Fig. 6
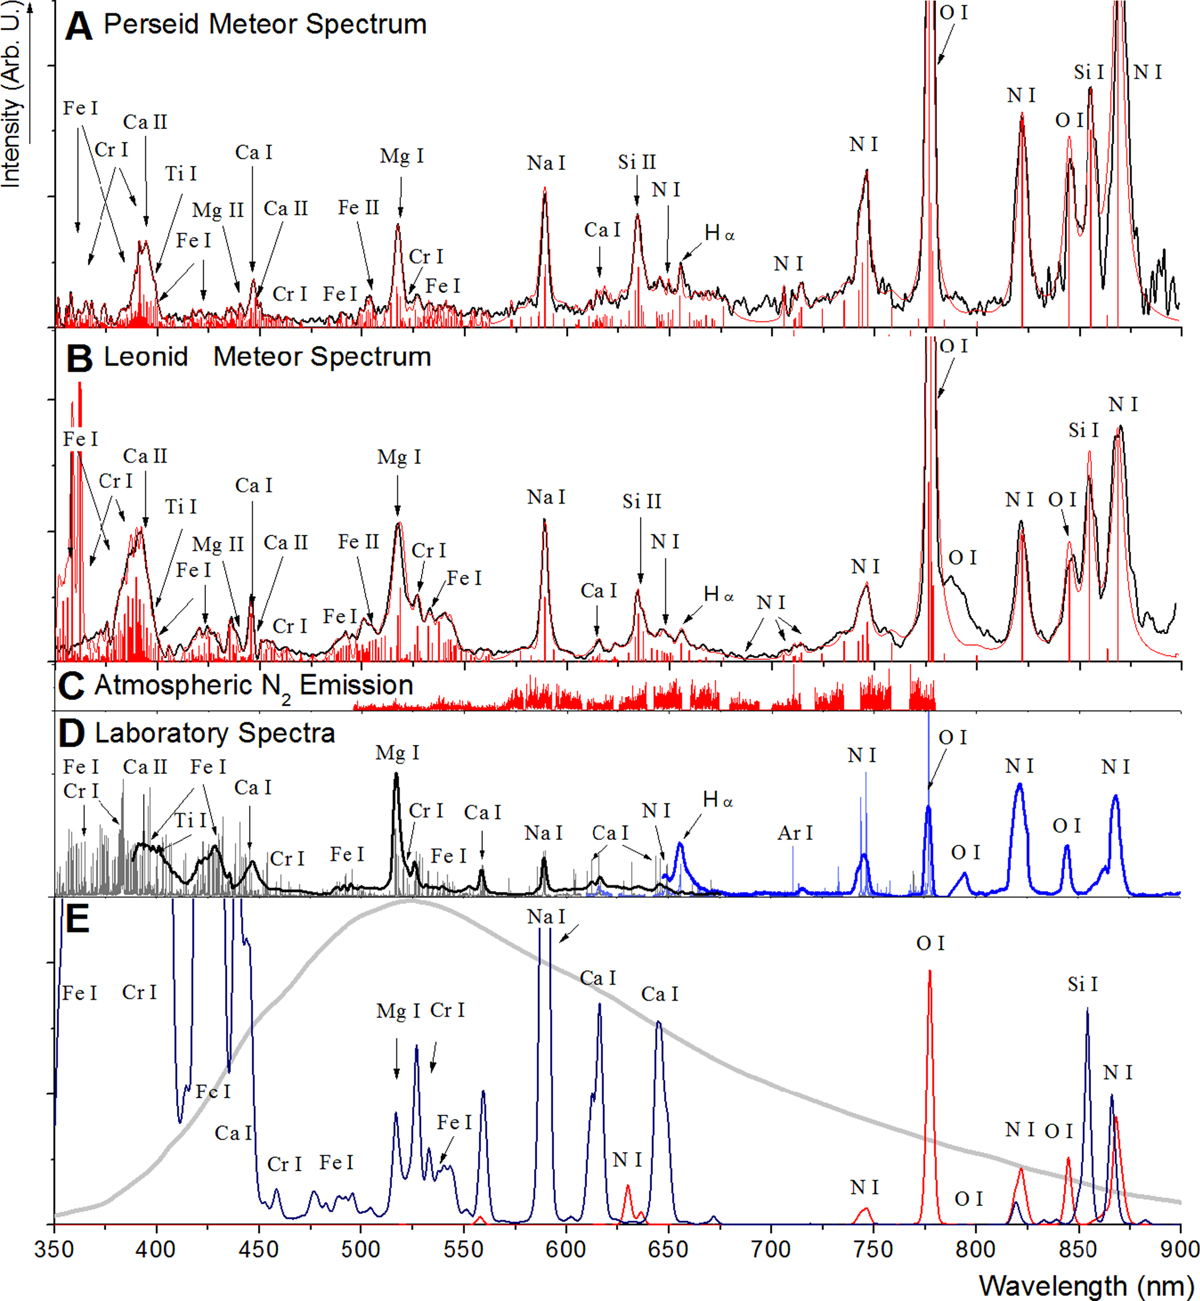
Panels A and B: assignment of the Perseid and Leonid bolides spectra (marked in black), together with the convolution of lines (intensity and position displayed in stick diagram), simulated using the Fytik programme and a preliminary version of Meteor Master. For clarity, panel C shows separately the positions and intensities of the molecular nitrogen spectrum used in the convolution model. Panel D: experimental spectrum of the laser ablation of chondrite, calculated as a sum of all the samples measured in this study. The high-resolution spectrum, recorded using an echelle spectrograph, is marked in grey; the low-resolution experimental ablation spectrum, recorded in situ by a meteor camera, is shown in black. Similarly, the LIDB spectrum in the air from the high-resolution echelle is depicted in blue, while the low-resolution spectrum from the camera is depicted in dark blue. Panel E: synthetic spectra of the Leonide meteor computed using approximately 22 000 lines from the NIST database (Ralchenko et al. 2013) for temperature of 4667 K and electron density of 4 X 104 cm−3. The blue line represents the simulated spectra of the Leonide meteor (abundances according to Table 1), the red line shows airglow of 78% N and 21% O and the grey line illustrates the quantum efficiency of the meteor spectral camera. Intensities of Ca I, Fe I and Cr I above 450 nm are artificially suppressed by the instrument.
Current usage metrics show cumulative count of Article Views (full-text article views including HTML views, PDF and ePub downloads, according to the available data) and Abstracts Views on Vision4Press platform.
Data correspond to usage on the plateform after 2015. The current usage metrics is available 48-96 hours after online publication and is updated daily on week days.
Initial download of the metrics may take a while.