Fig. 4
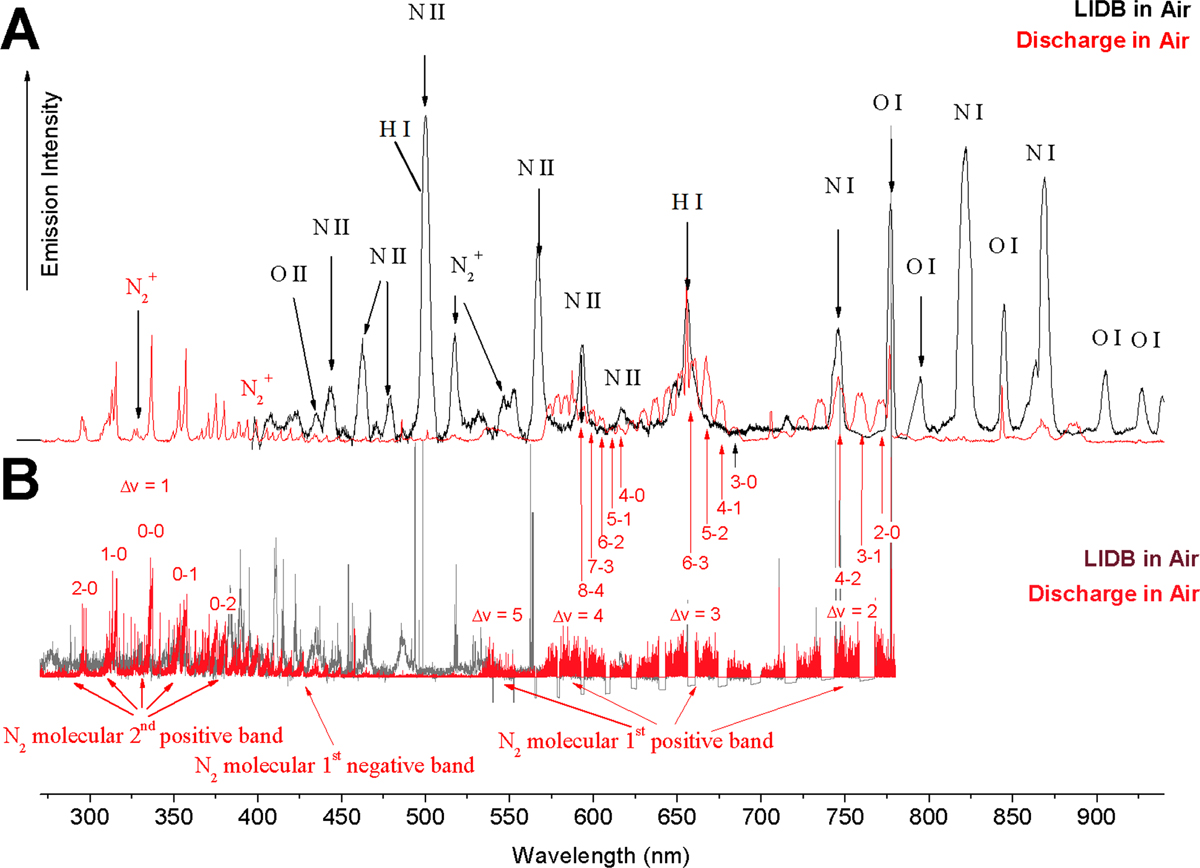
Panel A: Low-resolution spectrum recorded using a meteor spectral camera; panel B: High-resolution spectrum measured using the Echelle high-resolution spectrograph. Spectra shown in black and grey belong to laser-induced breakdown in the air; those in red belong to electric discharge. The most prominent atomic species (black letters in panel A) and molecular bands (N2 and N+ 2) are assigned in panels A and B, respectively.
Current usage metrics show cumulative count of Article Views (full-text article views including HTML views, PDF and ePub downloads, according to the available data) and Abstracts Views on Vision4Press platform.
Data correspond to usage on the plateform after 2015. The current usage metrics is available 48-96 hours after online publication and is updated daily on week days.
Initial download of the metrics may take a while.