Fig. 9
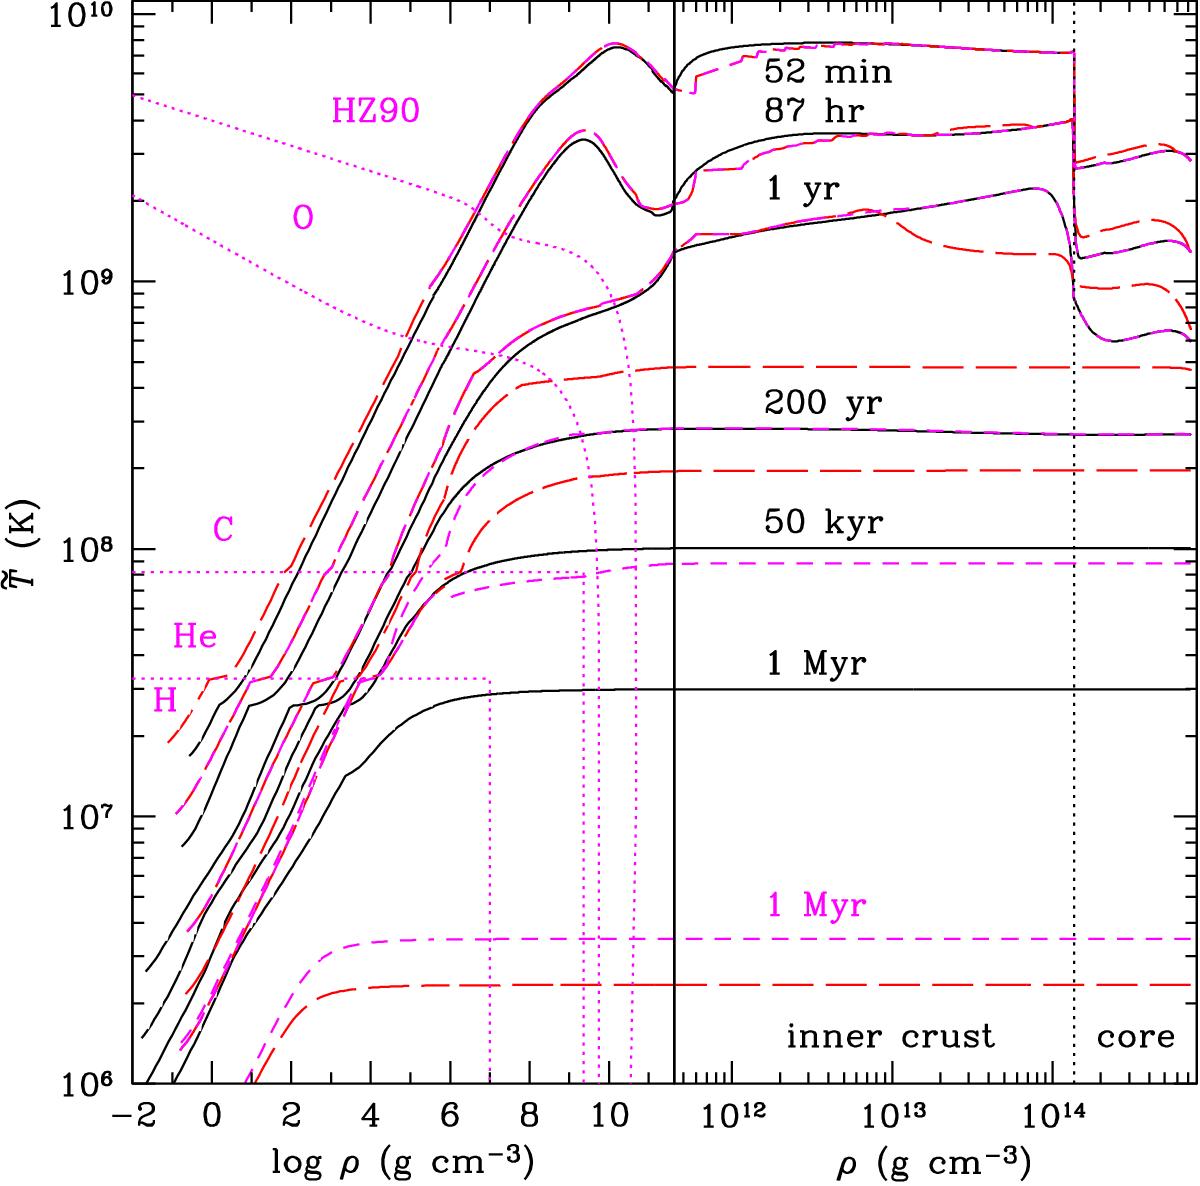
Redshifted temperature as a function of mass density inside a neutron star for three of the seven different models considered in Fig. 8 (namely, models 1, 2, and 7), plotted using the same line styles, at different ages marked near the curves. The two parts of the figure, separated by the vertical solid line, show the regions before and after neutron drip at different density scales. The dotted lines in the left half of the figure show the adopted density-temperature domains for different chemical elements (H, 4He, 12C, 16O) in the accreted envelope. To the right of the last of these lines, the composition of the accreted crust is adopted from Haensel & Zdunik (1990). For the nonaccreted crust, we use the ground-state composition of matter according to the BSk24 model. The vertical dotted line in the right half of the figure separates the crust and the core.
Current usage metrics show cumulative count of Article Views (full-text article views including HTML views, PDF and ePub downloads, according to the available data) and Abstracts Views on Vision4Press platform.
Data correspond to usage on the plateform after 2015. The current usage metrics is available 48-96 hours after online publication and is updated daily on week days.
Initial download of the metrics may take a while.