Fig. 7
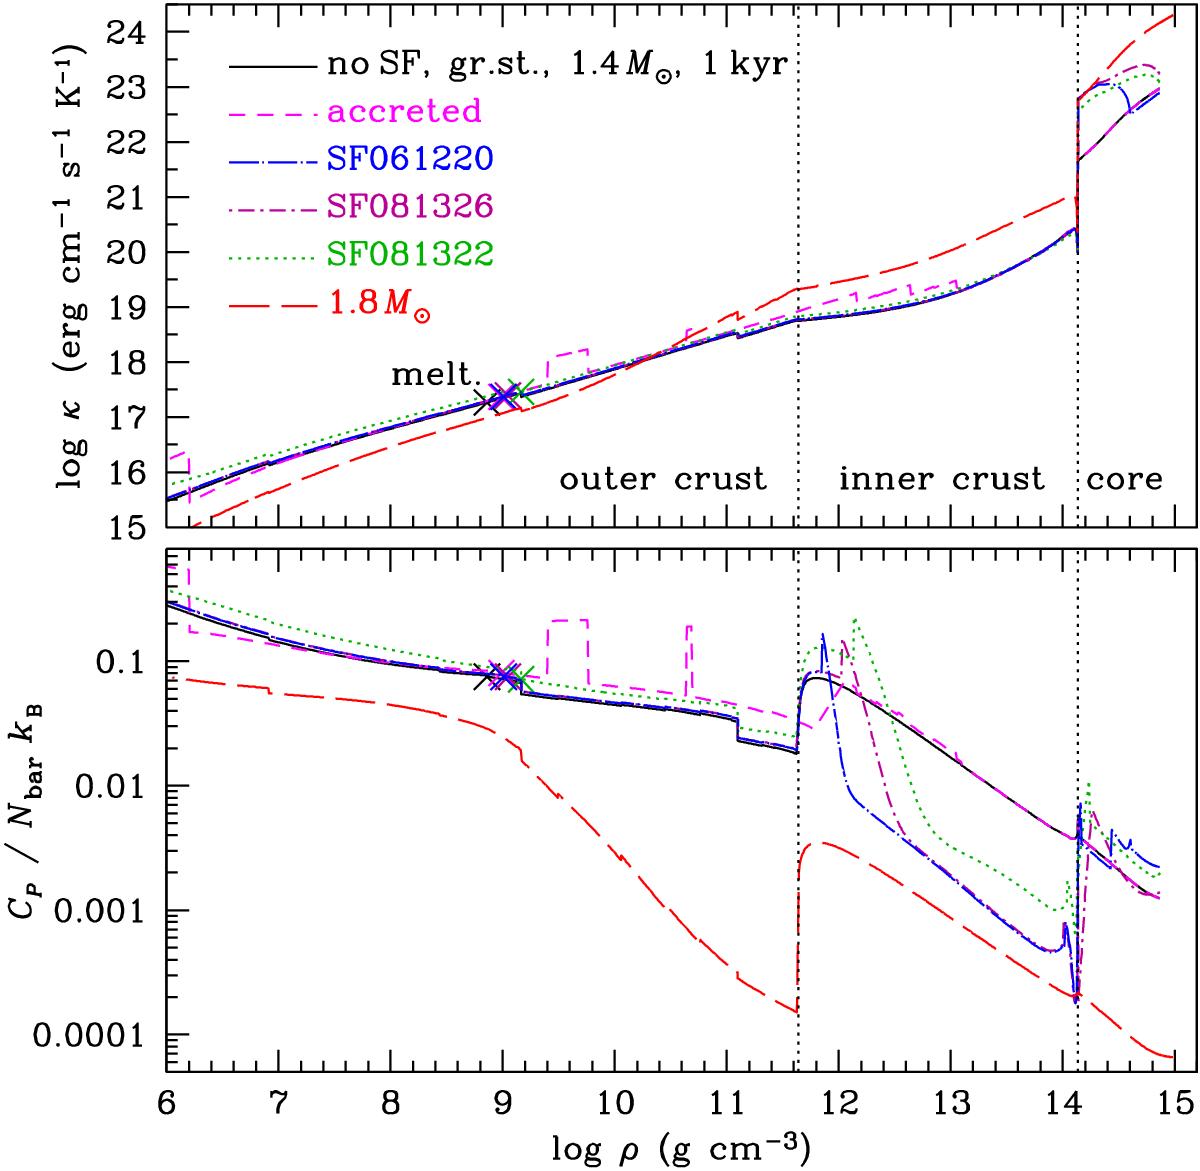
Thermal conductivity (upper panel) and heat capacity per baryon in units of kB (lower panel) as functions of mass density at age t = 1 kyr for the same neutron star models as in Fig. 6. The crosses mark the melting points for the models with M = 1.4 M⊙: to the left of them, the Coulomb plasma forms a liquid ocean. For the M = 1.8 M⊙ model, the crust does not melt in the displayed density range, because it is relatively cold at this age (cf. Fig. 4). The vertical dotted lines mark the outer and inner boundaries of the inner crust.
Current usage metrics show cumulative count of Article Views (full-text article views including HTML views, PDF and ePub downloads, according to the available data) and Abstracts Views on Vision4Press platform.
Data correspond to usage on the plateform after 2015. The current usage metrics is available 48-96 hours after online publication and is updated daily on week days.
Initial download of the metrics may take a while.