Fig. 2
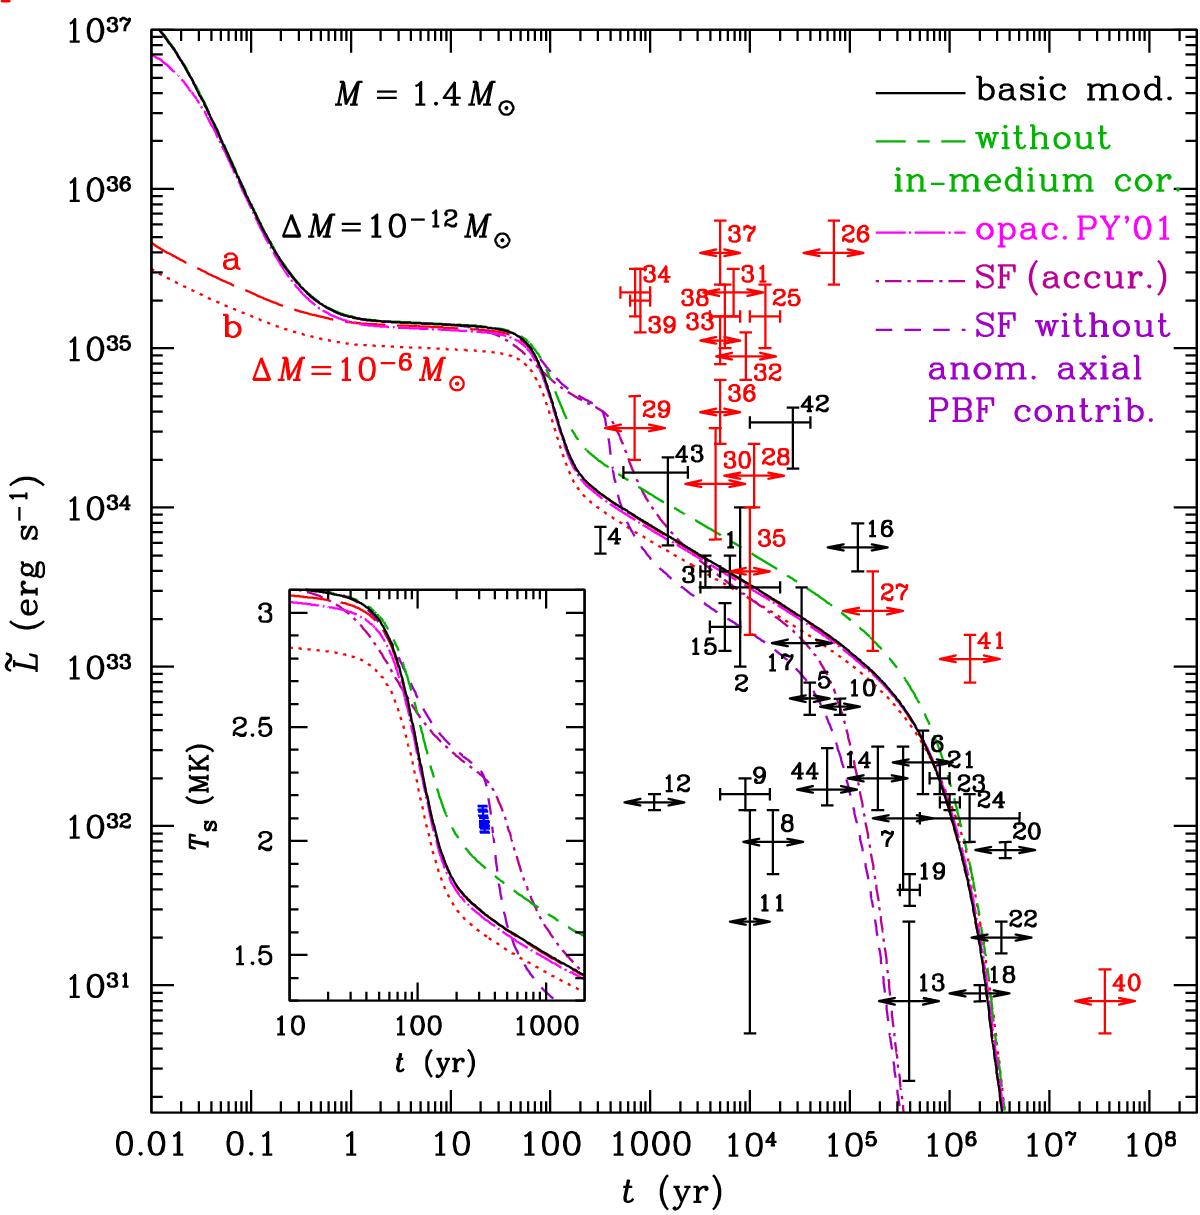
Theoretical cooling curves (redshifted thermal luminosity ![]() as a function of stellar age t) for a neutron star with mass M = 1.4 M⊙, calculated using different microphysics inputs (see text for detail), versus observations of thermally emitting neutron stars. Vertical errorbars show estimated thermal luminosities, horizontal errorbars are estimated ranges of kinematic ages, short horizontal arrows replace the horizontal errorbars in the cases where no confidence interval for the kinematic age is found in the literature, and longer horizontal arrows are placed if no kinematic age is available (in such cases, the characteristic ages are adopted). Numbers 1–41 enumerate the entries in Table 3 of Potekhin et al. (2015). We have updated the data for object 4 according to Posselt et al. (2013) and added objects 42 (XMMU J173203.3−344518, Klochkov et al. 2015), 43 (CXOU J181852.0−150213, Klochkov et al. 2016), and 44 (PSR J0633+0632, Danilenko et al. 2015; Karpova et al. 2017). The errorbars and arrows for magnetars are drawn in red color. The inset shows the nonredshifted effective surface temperature Teff as function of t in a shorter time interval, which corresponds to the ages at which nucleon superfluidity is expected to develop in the interior of the neutron star. The symbols in the inset reproduce the data for the central compact object in the Cas A supernova remnant from Table I of Ho et al. (2015). The solid line shows the basic cooling curve, calculated using a thin quasi-stationary envelope and the most advanced physics input, except nucleon superfluidity; the long-dashed line is calculated using the same input but with a traditional (thicker) blanketing envelope treated as quasi-stationary; the dotted line is calculated using the traditional blanketing envelope and an alternative model of radiative opacities (see text); the dot-long-dashed line shows the result of replacement of the opacities shown in Fig. 1 by the simplified opacities of Potekhin & Yakovlev (2001); alternating long and short dashes demonstrate the result of neglect of the in-medium corrections; the dot-dashed cooling curve is calculated with allowance for nucleon superfluidity (one selected model for each of the three types of superfluidity: neutron singlet pairing in the crust, proton singlet and neutron triplet pairing in the core; see text for details); the short-dashed line is calculated for the same superfluidity model but without account of the anomalous axial contribution to the PBF neutrino emission.
as a function of stellar age t) for a neutron star with mass M = 1.4 M⊙, calculated using different microphysics inputs (see text for detail), versus observations of thermally emitting neutron stars. Vertical errorbars show estimated thermal luminosities, horizontal errorbars are estimated ranges of kinematic ages, short horizontal arrows replace the horizontal errorbars in the cases where no confidence interval for the kinematic age is found in the literature, and longer horizontal arrows are placed if no kinematic age is available (in such cases, the characteristic ages are adopted). Numbers 1–41 enumerate the entries in Table 3 of Potekhin et al. (2015). We have updated the data for object 4 according to Posselt et al. (2013) and added objects 42 (XMMU J173203.3−344518, Klochkov et al. 2015), 43 (CXOU J181852.0−150213, Klochkov et al. 2016), and 44 (PSR J0633+0632, Danilenko et al. 2015; Karpova et al. 2017). The errorbars and arrows for magnetars are drawn in red color. The inset shows the nonredshifted effective surface temperature Teff as function of t in a shorter time interval, which corresponds to the ages at which nucleon superfluidity is expected to develop in the interior of the neutron star. The symbols in the inset reproduce the data for the central compact object in the Cas A supernova remnant from Table I of Ho et al. (2015). The solid line shows the basic cooling curve, calculated using a thin quasi-stationary envelope and the most advanced physics input, except nucleon superfluidity; the long-dashed line is calculated using the same input but with a traditional (thicker) blanketing envelope treated as quasi-stationary; the dotted line is calculated using the traditional blanketing envelope and an alternative model of radiative opacities (see text); the dot-long-dashed line shows the result of replacement of the opacities shown in Fig. 1 by the simplified opacities of Potekhin & Yakovlev (2001); alternating long and short dashes demonstrate the result of neglect of the in-medium corrections; the dot-dashed cooling curve is calculated with allowance for nucleon superfluidity (one selected model for each of the three types of superfluidity: neutron singlet pairing in the crust, proton singlet and neutron triplet pairing in the core; see text for details); the short-dashed line is calculated for the same superfluidity model but without account of the anomalous axial contribution to the PBF neutrino emission.
Current usage metrics show cumulative count of Article Views (full-text article views including HTML views, PDF and ePub downloads, according to the available data) and Abstracts Views on Vision4Press platform.
Data correspond to usage on the plateform after 2015. The current usage metrics is available 48-96 hours after online publication and is updated daily on week days.
Initial download of the metrics may take a while.