Fig. 13
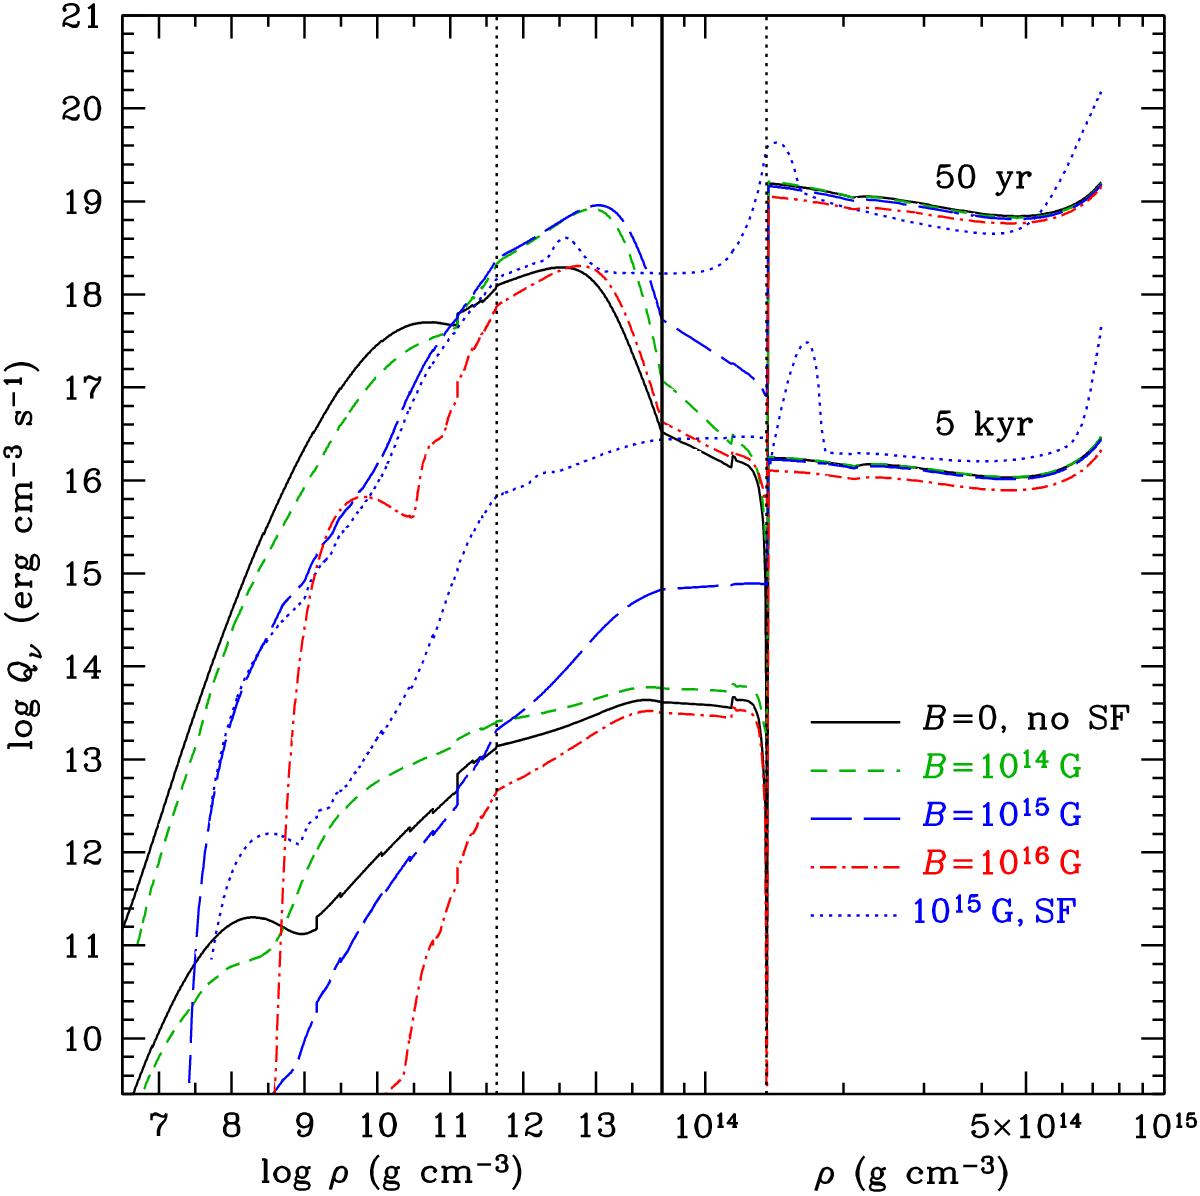
Neutrino emission power density as a function of mass density at ages 50 yr (upper curves) and 5 kyr (lower curves of each type) for nonsuperfluid magnetars with B = 1014 G (short-dashed lines), 1015 G (long-dashed lines), and 1016 G (dot-dashed lines) and for a magnetar with B = 1015 G and nucleon superfluidity (dotted lines), compared with neutrino emission of a nonmagnetic, nonsuperfluid neutron star (solid lines). The density scale is different in the left and right parts of the figure, separated by the vertical solid line. The vertical dotted lines mark the outer and inner boundaries of the inner crust.
Current usage metrics show cumulative count of Article Views (full-text article views including HTML views, PDF and ePub downloads, according to the available data) and Abstracts Views on Vision4Press platform.
Data correspond to usage on the plateform after 2015. The current usage metrics is available 48-96 hours after online publication and is updated daily on week days.
Initial download of the metrics may take a while.