Free Access
Fig. 4
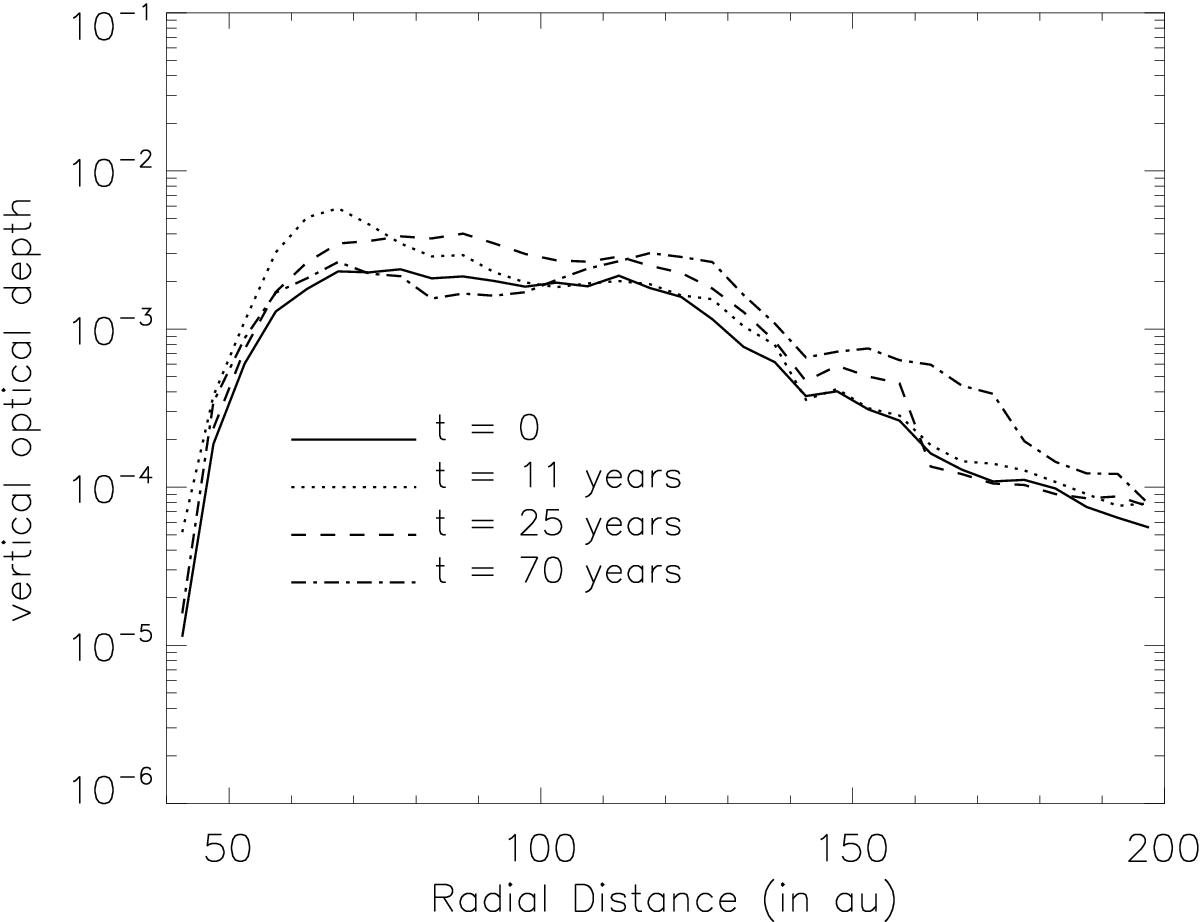
Radial cuts of the vertical optical depth, passing by the avalanche’s peak luminosity location, at four different epochs of the avalanche’s evolution. The profile at t = 0 serves as a reference profile to which the avalanche-induced dust-excess can be compared.
Current usage metrics show cumulative count of Article Views (full-text article views including HTML views, PDF and ePub downloads, according to the available data) and Abstracts Views on Vision4Press platform.
Data correspond to usage on the plateform after 2015. The current usage metrics is available 48-96 hours after online publication and is updated daily on week days.
Initial download of the metrics may take a while.