Fig. 6
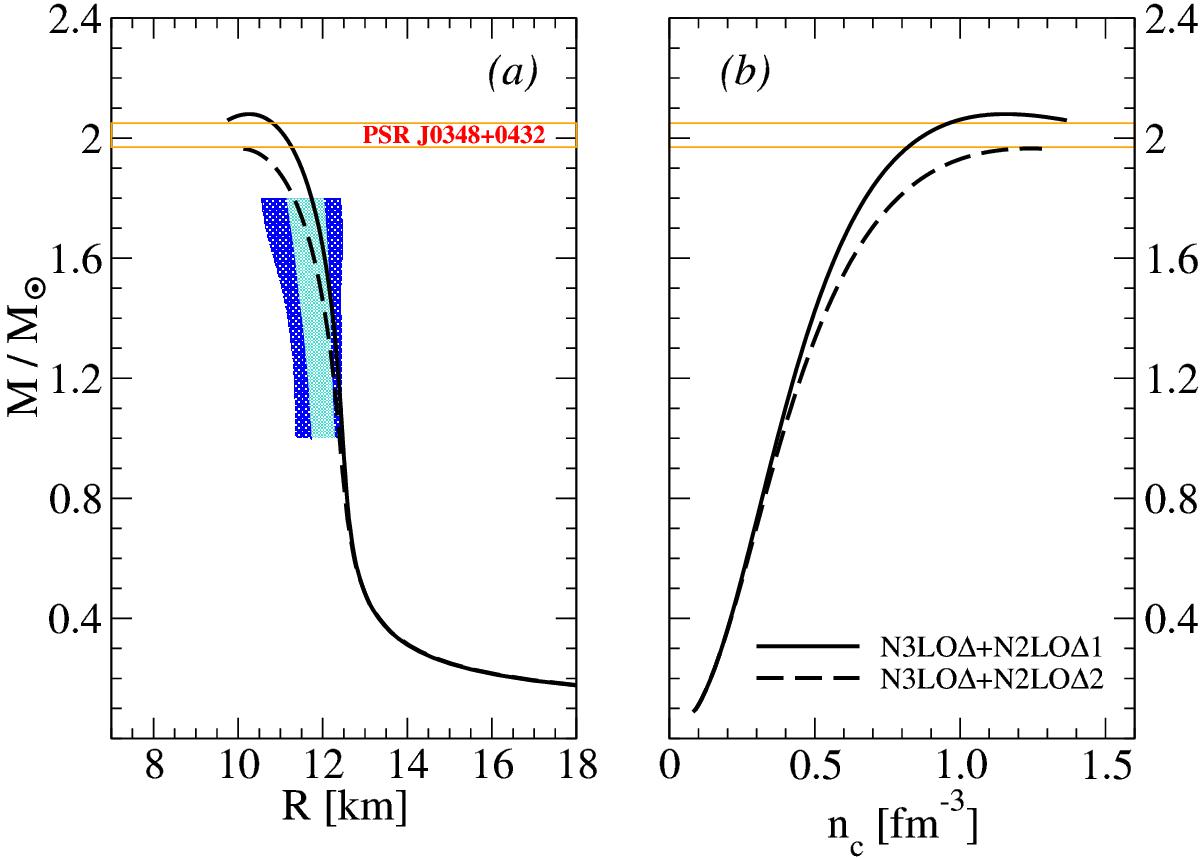
Mass–radius relationship (panel a) and mass–central baryon density relationship (panel b) for the two nuclear interaction models considered in this work. The hatched region in panel a represents the mass–radius constraints obtained by Steiner et al. (2010, 2013b). The strip with boundaries marked with orange lines stands for the measured mass M = 2.01 ± 0.04 M⊙ (Antoniadis et al. 2013) of the neutron stars in PSR J0348+0432.
Current usage metrics show cumulative count of Article Views (full-text article views including HTML views, PDF and ePub downloads, according to the available data) and Abstracts Views on Vision4Press platform.
Data correspond to usage on the plateform after 2015. The current usage metrics is available 48-96 hours after online publication and is updated daily on week days.
Initial download of the metrics may take a while.