Free Access
Fig. 4
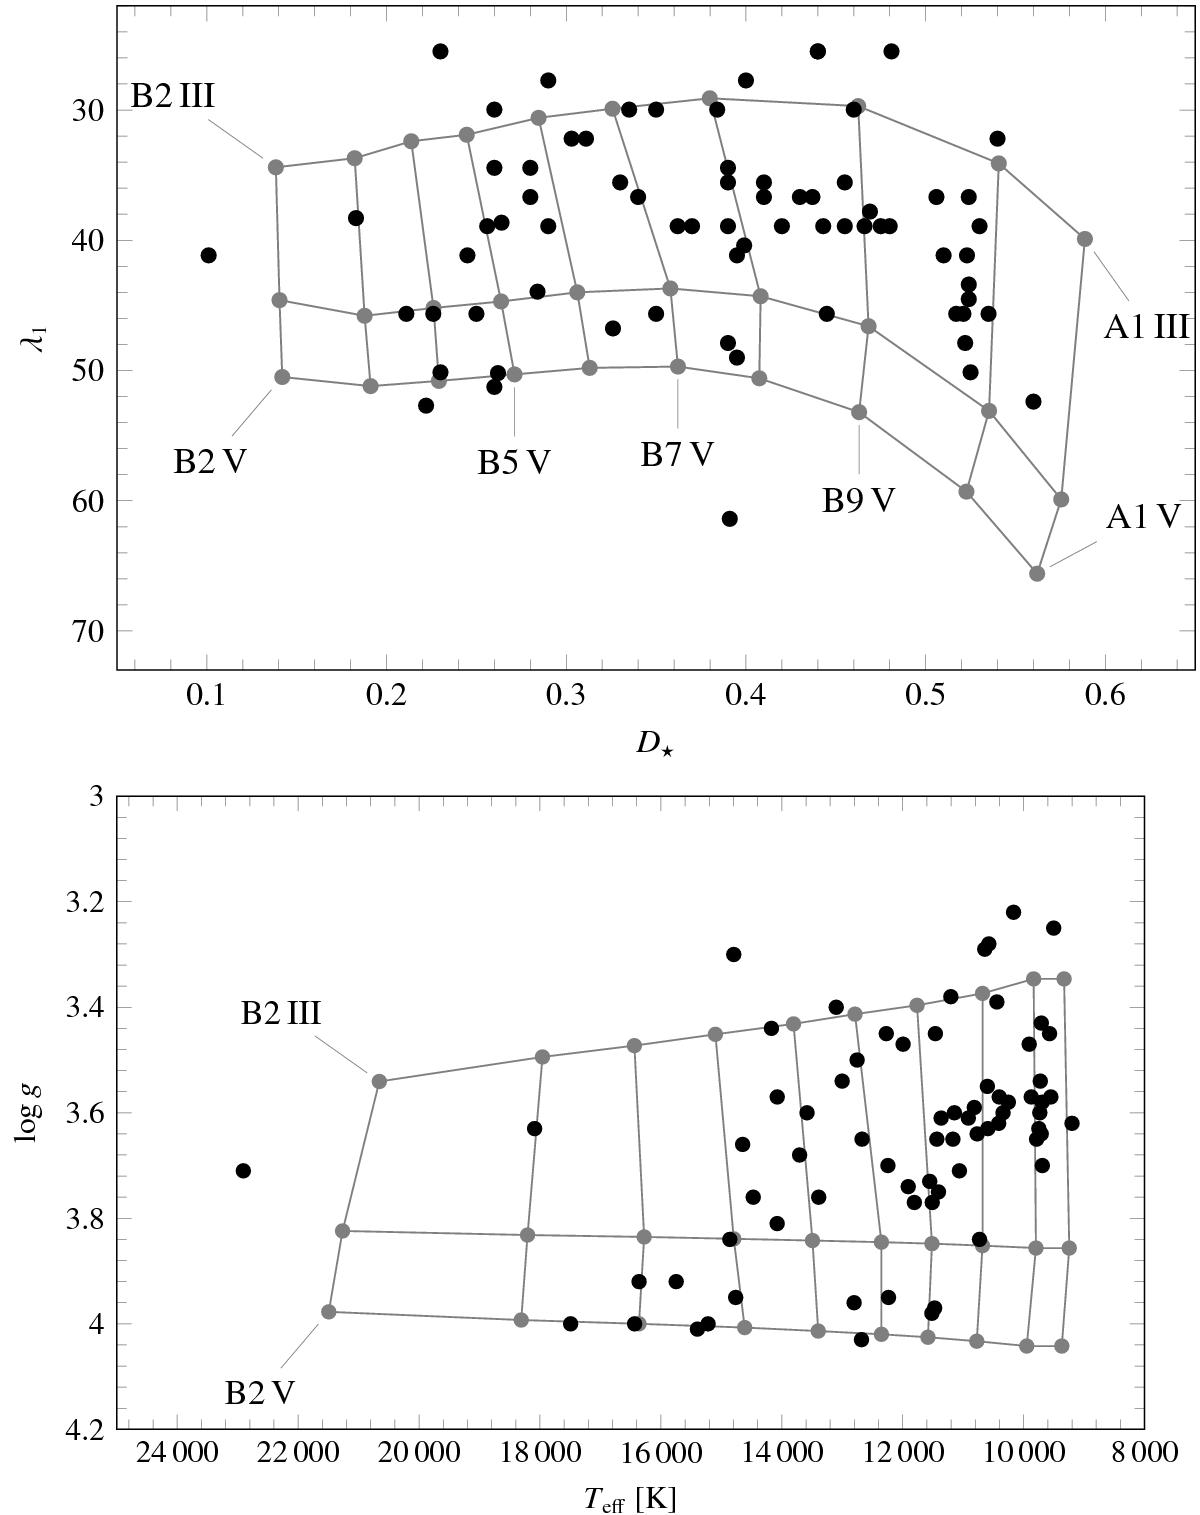
Distribution of the Be stars in the D⋆-λ1 plane (upper) and Teff-log g plane (lower). The model grid points symbolizing the center of the respective spectral types are shown in gray. The bias toward later type Be stars is clearly apparent from the lower panel, with only one star hotter than about 20 000 K.
This figure is made of several images, please see below:
Current usage metrics show cumulative count of Article Views (full-text article views including HTML views, PDF and ePub downloads, according to the available data) and Abstracts Views on Vision4Press platform.
Data correspond to usage on the plateform after 2015. The current usage metrics is available 48-96 hours after online publication and is updated daily on week days.
Initial download of the metrics may take a while.