Fig. 9
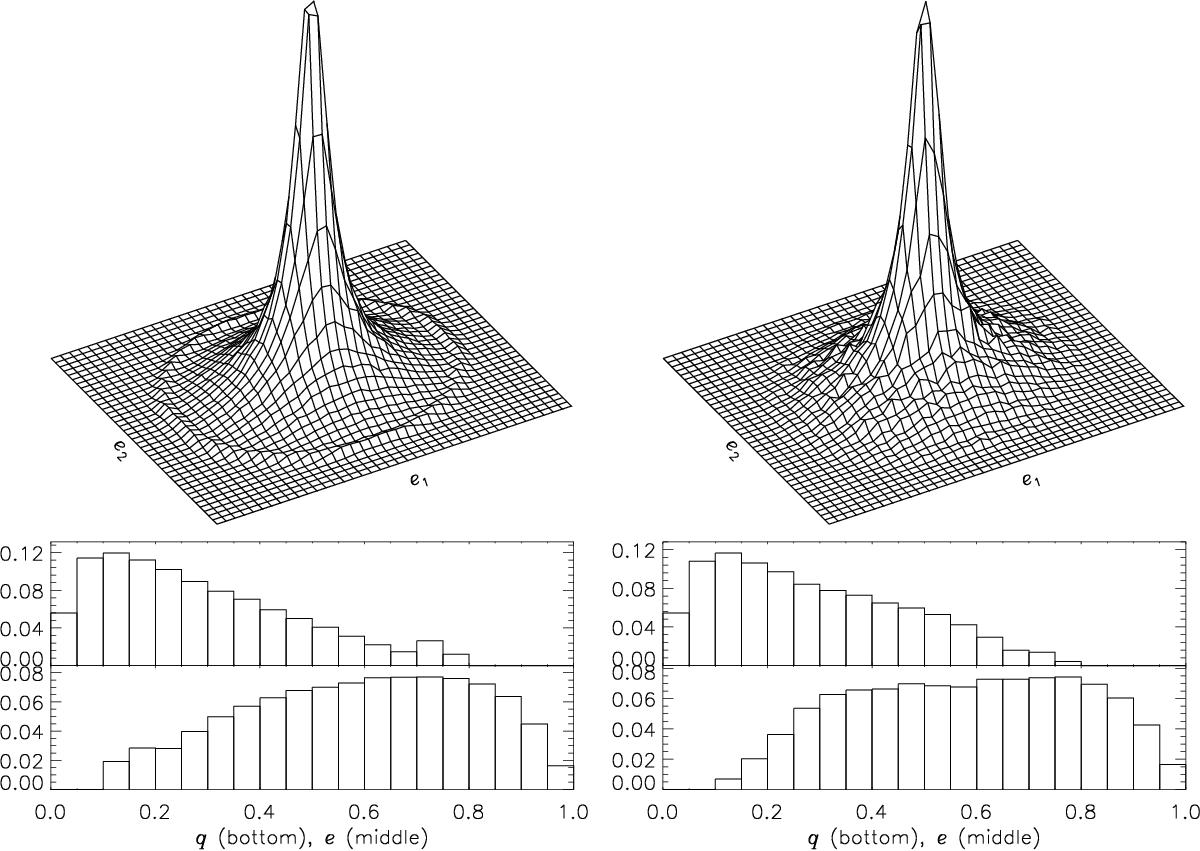
Ellipticity and axis ratio distributions for CFHTLenS blue (left), red (right). Top: a 2D histogram of ellipticities. Note that the ring-like feature at e ≈ 0.8 is due to noisy outliers forced to a maximum e by the shape measurement pipeline, but see also Fig. 8. Middle: histogram of the absolute ellipticity | e |. Bottom: histogram of the ellipse axis ratio q.
Current usage metrics show cumulative count of Article Views (full-text article views including HTML views, PDF and ePub downloads, according to the available data) and Abstracts Views on Vision4Press platform.
Data correspond to usage on the plateform after 2015. The current usage metrics is available 48-96 hours after online publication and is updated daily on week days.
Initial download of the metrics may take a while.