Fig. 7
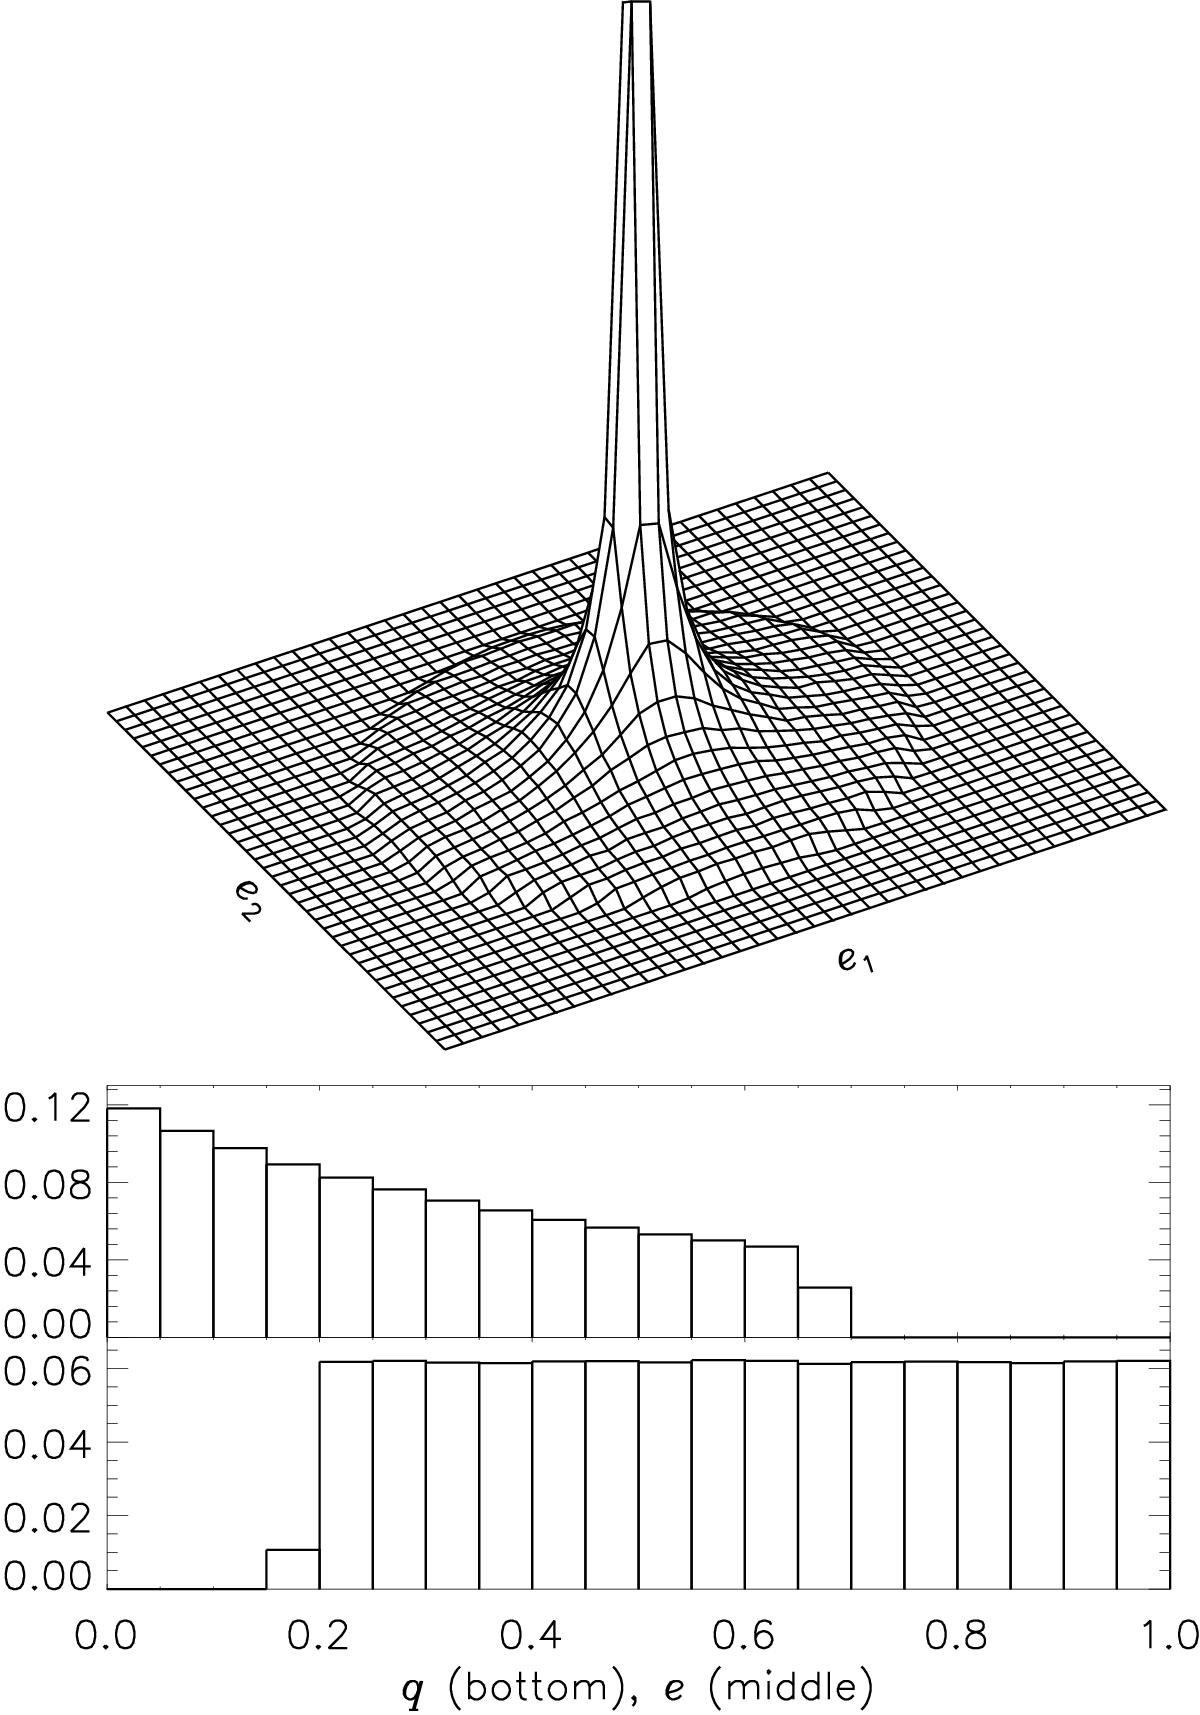
Ellipticity distributions for a uniform axis ratio distribution. Top: a 2D histogram of ellipticities. Middle: histogram of the absolute ellipticity | e |. Bottom: histogram of the ellipse axis ratio q. A cut-off near q ≈ 0.2 is suggested by observations and produces standard deviations in each ellipticity component of σe ≈ 0.25, comparable to most survey shape measurement catalogs.
Current usage metrics show cumulative count of Article Views (full-text article views including HTML views, PDF and ePub downloads, according to the available data) and Abstracts Views on Vision4Press platform.
Data correspond to usage on the plateform after 2015. The current usage metrics is available 48-96 hours after online publication and is updated daily on week days.
Initial download of the metrics may take a while.