Fig. 5
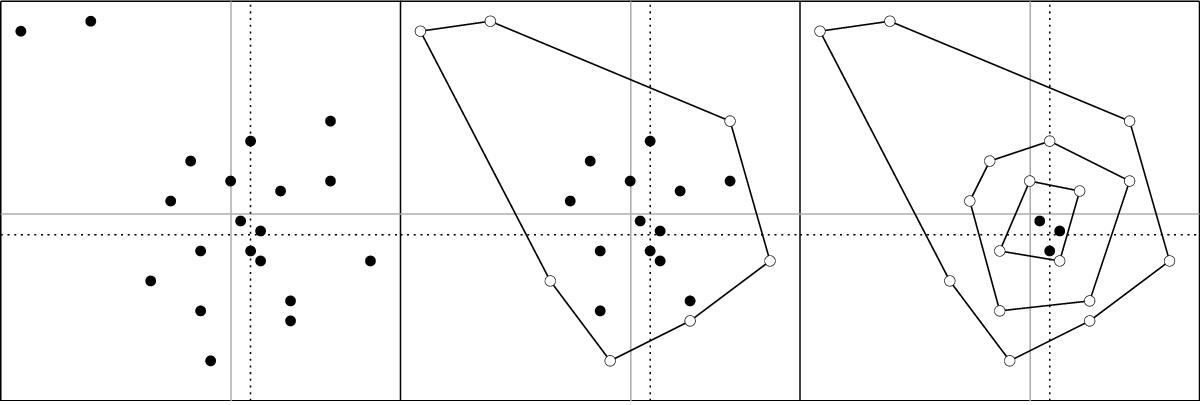
The method of CHP. The left panel shows a scatter plot with two outliers. The arithmetic mean is shown as a gray, solid line and the dotted line represents the mean without the two outliers. The middle panel shows the convex hull of the set of points, which is then removed from the set. The right panel shows the final result after repeating the process, until the final set of points is equal to its own convex hull.
Current usage metrics show cumulative count of Article Views (full-text article views including HTML views, PDF and ePub downloads, according to the available data) and Abstracts Views on Vision4Press platform.
Data correspond to usage on the plateform after 2015. The current usage metrics is available 48-96 hours after online publication and is updated daily on week days.
Initial download of the metrics may take a while.