Fig. 4
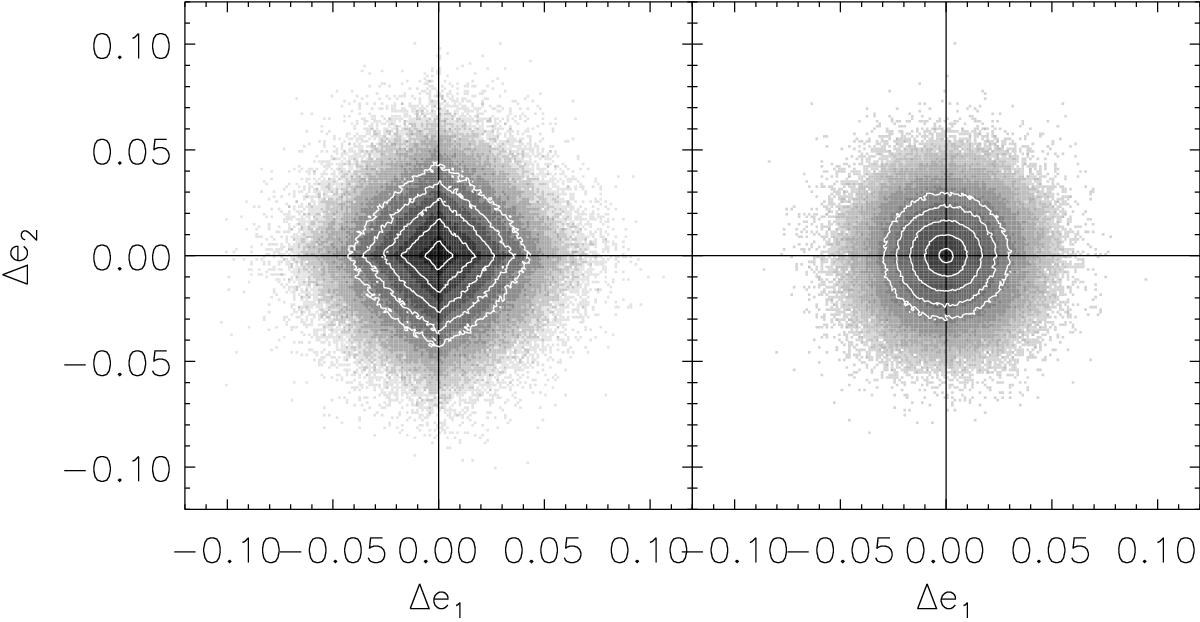
Comparison of the marginal median (left) to the spatial median, or LAD estimation (right). Plotted are the estimation biases Δe for 106 simulation runs, shown as a density in grayscale. Over-plotted are arbitrary contours of increasing density (equal in both plots), to highlight the anisotropy in P(Δe). Since e1 and e2 depend on the choice of reference frame, the marginal median introduces an artificial anisotropy. For the LAD estimations, the residual distances | ri | do not depend on the choice of reference frame.
Current usage metrics show cumulative count of Article Views (full-text article views including HTML views, PDF and ePub downloads, according to the available data) and Abstracts Views on Vision4Press platform.
Data correspond to usage on the plateform after 2015. The current usage metrics is available 48-96 hours after online publication and is updated daily on week days.
Initial download of the metrics may take a while.