Fig. 16
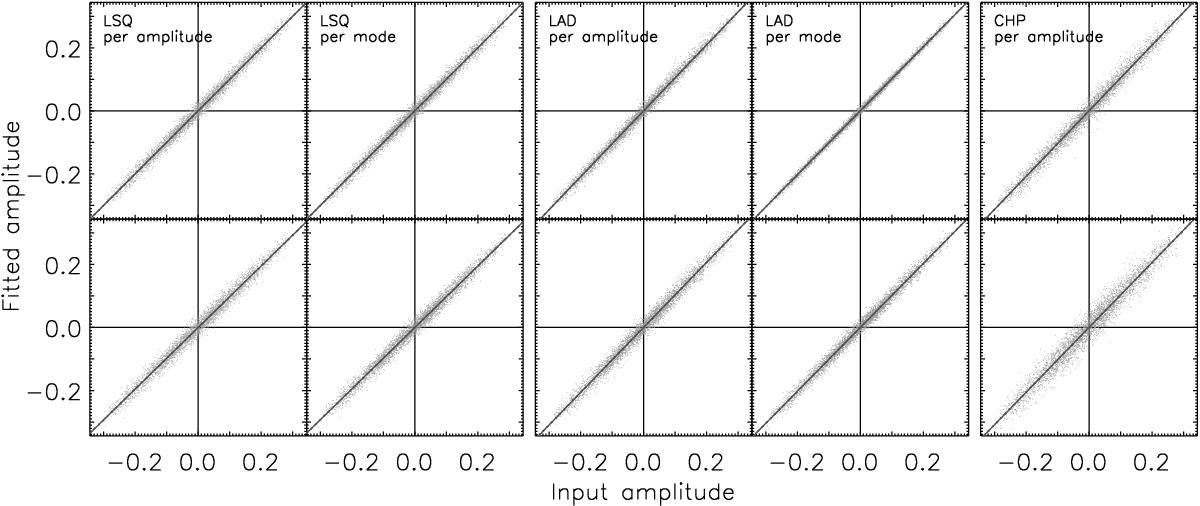
Consistency of the estimated Fourier amplitudes as defined in Eq. (14). Plotted are the input amplitudes amn, bmn, cmn, dmn vs. their estimates (Sect. 3.3.1) for LSQ (left), LAD (middle), and CHP (right). Top row: only simulated intrinsic shapes based on projected ellipsoids. Bottom row: the same, with added noise. Over plotted are the best-fitting mean-bias, as defined in Eq. (25).
Current usage metrics show cumulative count of Article Views (full-text article views including HTML views, PDF and ePub downloads, according to the available data) and Abstracts Views on Vision4Press platform.
Data correspond to usage on the plateform after 2015. The current usage metrics is available 48-96 hours after online publication and is updated daily on week days.
Initial download of the metrics may take a while.