Fig. 15
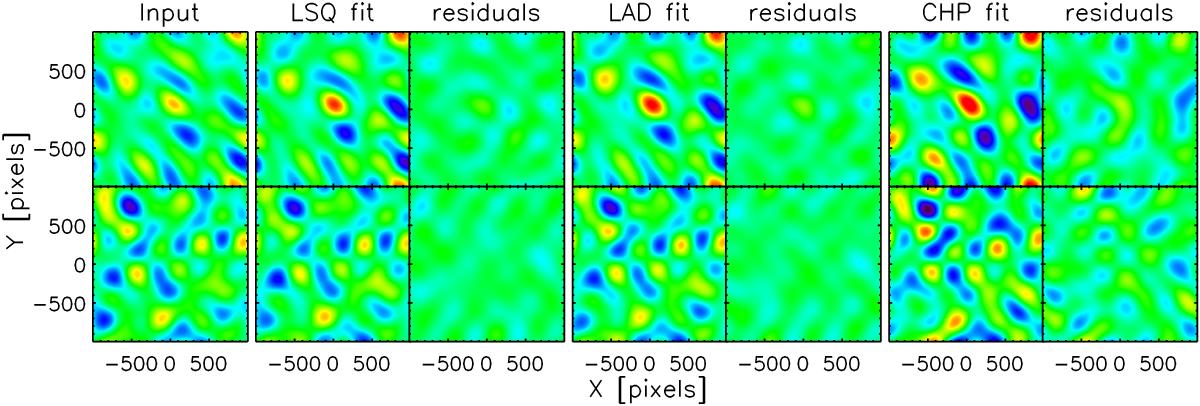
Shear field residuals when fitting 16 different modes, using simulated projected ellipsoids as intrinsic shapes, and including additional Gaussian noise. From left to right: input shear, LSQ fit and residuals, LAD fit and residuals, CHP it and residuals. Upper and lower row show e1 and e2 respectively. The color scale is the same in all plots for comparison and ranges between −0.247 ≤ e1,2 ≤ 0.247. Residuals for this realization vary between ± 0.075, ± 0.066, and ± 0.14, respectively.
Current usage metrics show cumulative count of Article Views (full-text article views including HTML views, PDF and ePub downloads, according to the available data) and Abstracts Views on Vision4Press platform.
Data correspond to usage on the plateform after 2015. The current usage metrics is available 48-96 hours after online publication and is updated daily on week days.
Initial download of the metrics may take a while.