Fig. 14
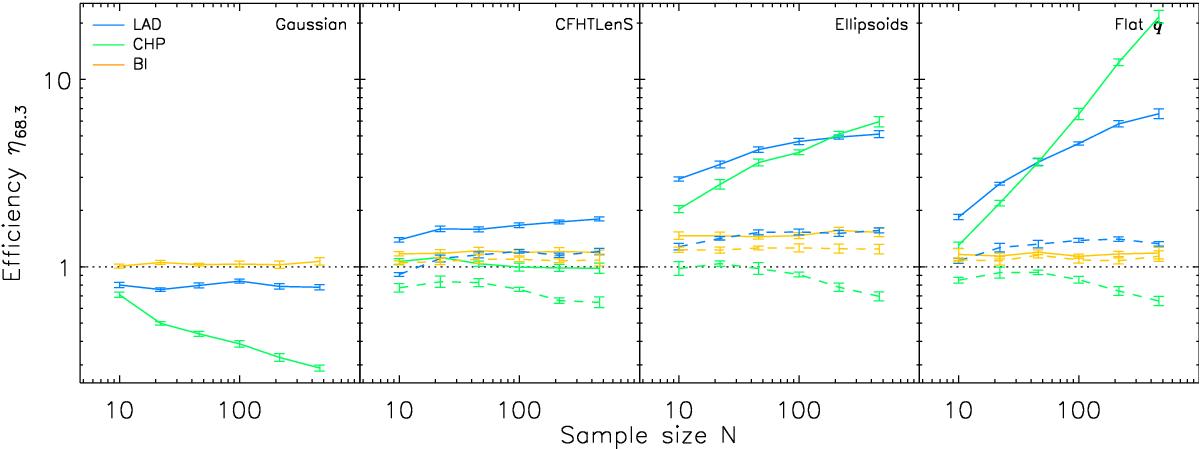
Relative efficiencies η68.3 plotted against sample sizes. From left to right: relative efficiencies in case of a Gaussian P(e) distribution, the CFHTLenS catalog P(e) distribution, a combination of disk and elliptical distributions using projected ellipsoids, and a uniform q distribution. Color coding: relative efficiencies for êLAD (blue), êBI (yellow), and êCHP (green). Solid lines: simulated samples without noise or using the CFHTLenS conservative subset. Dashed lines: including noise or using the complete CFHTLenS set.
Current usage metrics show cumulative count of Article Views (full-text article views including HTML views, PDF and ePub downloads, according to the available data) and Abstracts Views on Vision4Press platform.
Data correspond to usage on the plateform after 2015. The current usage metrics is available 48-96 hours after online publication and is updated daily on week days.
Initial download of the metrics may take a while.