Fig. 10
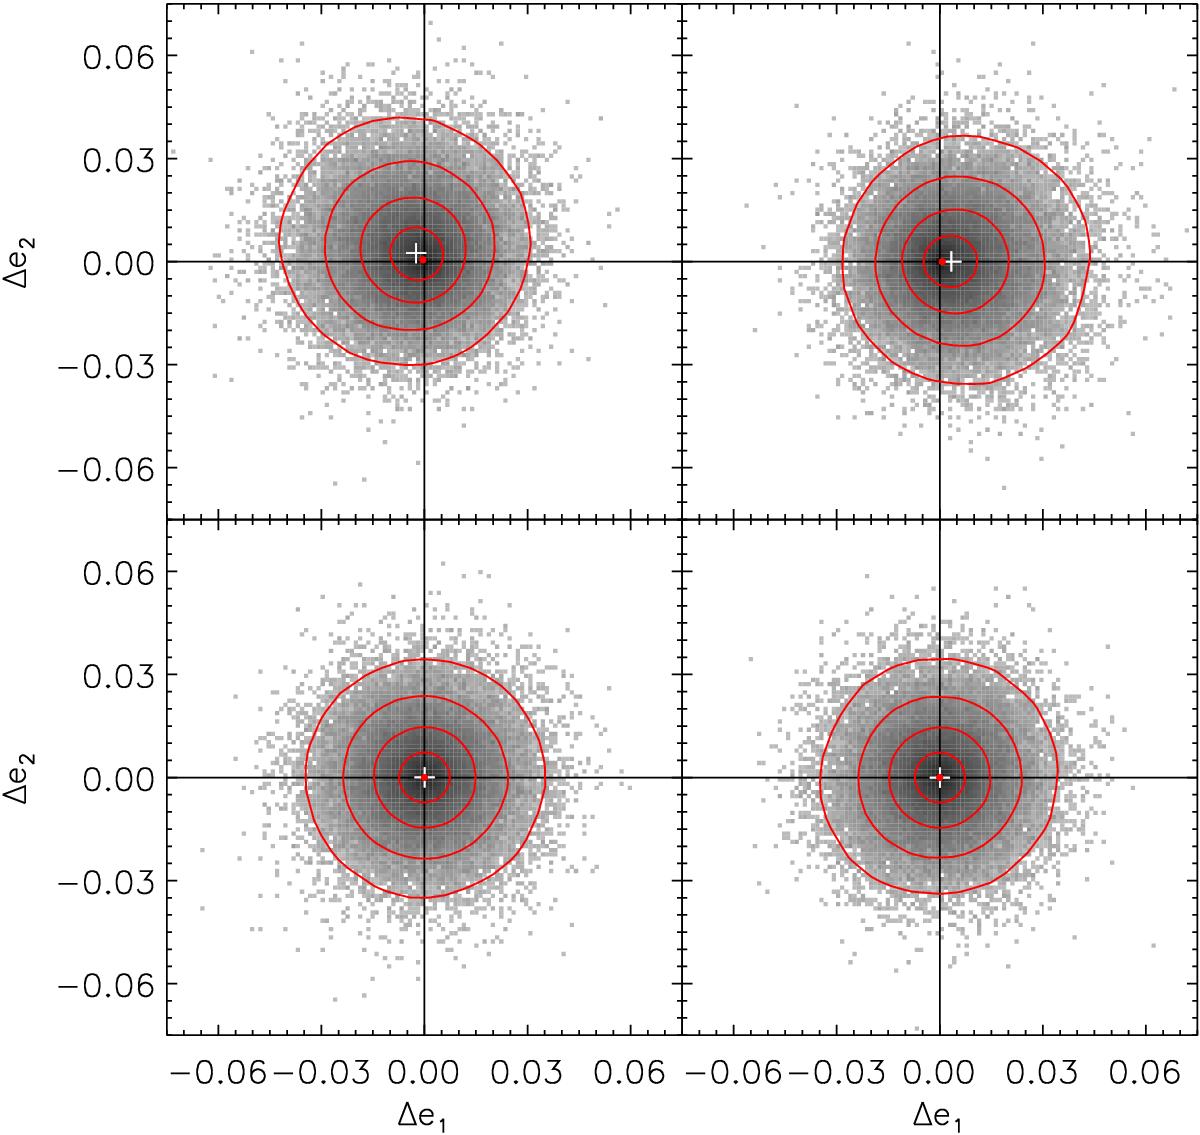
The skewed êCHP distribution as an example of the effect of asymmetry in a sheared ellipticity distribution. Plotted are the estimation biases Δe for 105 simulation runs, shown as a density in grayscale. Over-plotted are the convex hulls at approximately 38.3%, 68.3%, 86.6%, and 95.4% coverage. The mean of the distribution is shown as a white plus. Top: estimation biases ΔeCHP for samples with an underlying shear of g = −0.21 + 0.21i (left) and g = 0.3 (right). Note that these estimator distributions are effectively mean-biased, because they are skewed, but still centered around Δe = 0, as indicated by the CHP estimation of the distributions. Bottom: ΔeCHP for the same samples, after iteratively de-shearing the samples until the final CHP estimate vanishes. These iterations remove asymptotic mean-bias and increase efficiency.
Current usage metrics show cumulative count of Article Views (full-text article views including HTML views, PDF and ePub downloads, according to the available data) and Abstracts Views on Vision4Press platform.
Data correspond to usage on the plateform after 2015. The current usage metrics is available 48-96 hours after online publication and is updated daily on week days.
Initial download of the metrics may take a while.