Free Access
Fig. 6
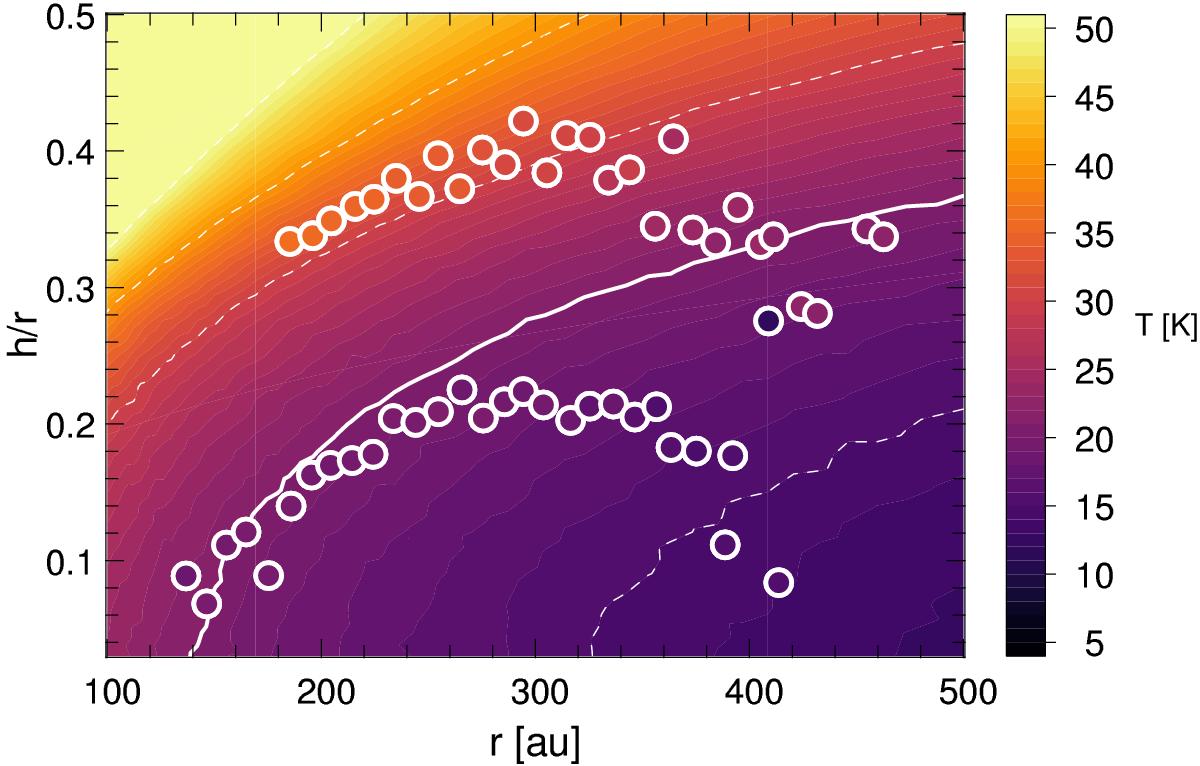
Comparison of the measured temperature (points) with the temperature structure from our MCFOST model (background). The same colour map is used for the data and the model. The white contour is the T = 21 K level, and the dashed contours correspond to T = 15, 30, 40, and 50 K.
Current usage metrics show cumulative count of Article Views (full-text article views including HTML views, PDF and ePub downloads, according to the available data) and Abstracts Views on Vision4Press platform.
Data correspond to usage on the plateform after 2015. The current usage metrics is available 48-96 hours after online publication and is updated daily on week days.
Initial download of the metrics may take a while.