Fig. 7
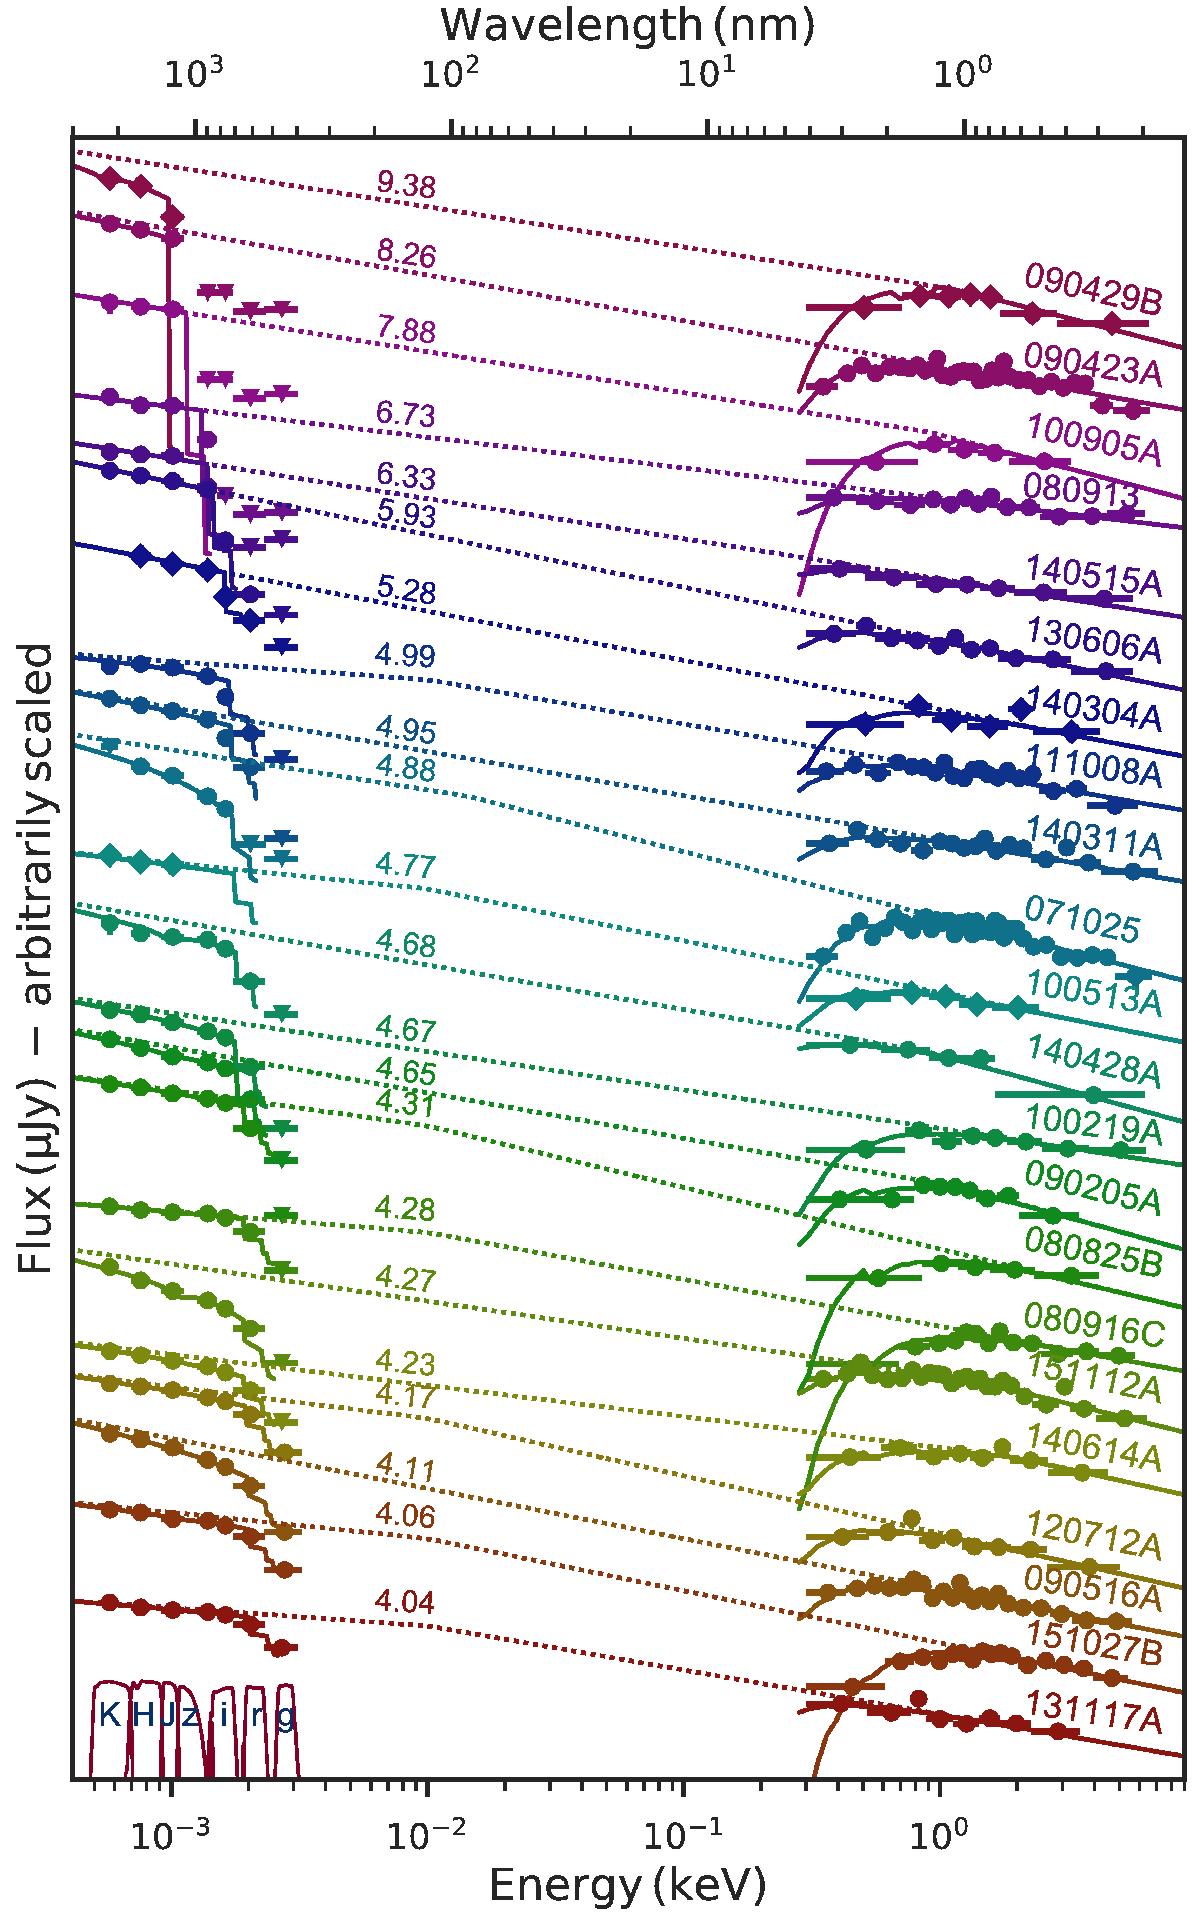
Spectral energy distribution for the 22 GRBs analyzed in this paper with increasing redshift from the bottom to top (as labeled). Data for GRBs detected with GROND are plotted with circles, data from other instruments with diamonds. The X-ray spectrum, if not available simultaneously to the optical and NIR data, was flux normalized to the mid-time of the chosen GROND exposure. Dashed lines indicate the unabsorbed best-fit models. Solid lines indicate the best-fit model including absorption: in the X-rays due to galactic plus host intrinsic absorption by medium weight metals; in the optical and NIR range due to host intrinsic absorption by dust (the data were corrected for galactic foreground reddening beforehand). The flux on the y-axis is completely arbitrary to get a better visualization. In the left corner at the bottom of the plot we also show the GROND filter curves.
Current usage metrics show cumulative count of Article Views (full-text article views including HTML views, PDF and ePub downloads, according to the available data) and Abstracts Views on Vision4Press platform.
Data correspond to usage on the plateform after 2015. The current usage metrics is available 48-96 hours after online publication and is updated daily on week days.
Initial download of the metrics may take a while.