Fig. 8
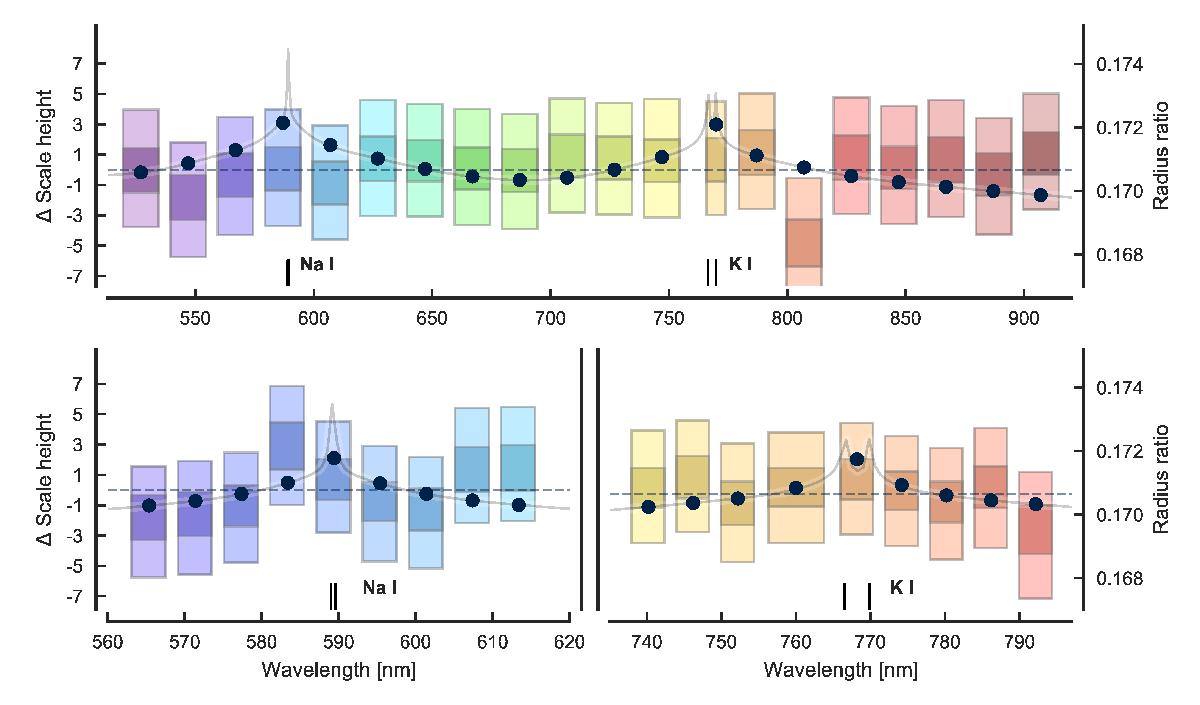
Transmission spectra for the NB dataset with 20 passbands spanning from 520 nm to 920 nm (top), the na i set covering the Na I doublet (bottom left), and the k i dataset covering the K I double (bottom right). The inner boxes correspond to the central 68% posterior intervals, the outer boxes to the central 99% posterior intervals, and Na I and K I lines are marked as black lines. The light grey line shows an Exo-Transmit spectrum with Na and K described in Sect. 7.2, the black dots show the Exo-Transmit spectrum binned to the dataset binning, and the slashed horizontal line shows the transmission spectrum mean.
Current usage metrics show cumulative count of Article Views (full-text article views including HTML views, PDF and ePub downloads, according to the available data) and Abstracts Views on Vision4Press platform.
Data correspond to usage on the plateform after 2015. The current usage metrics is available 48-96 hours after online publication and is updated daily on week days.
Initial download of the metrics may take a while.