Free Access
Fig. A.1
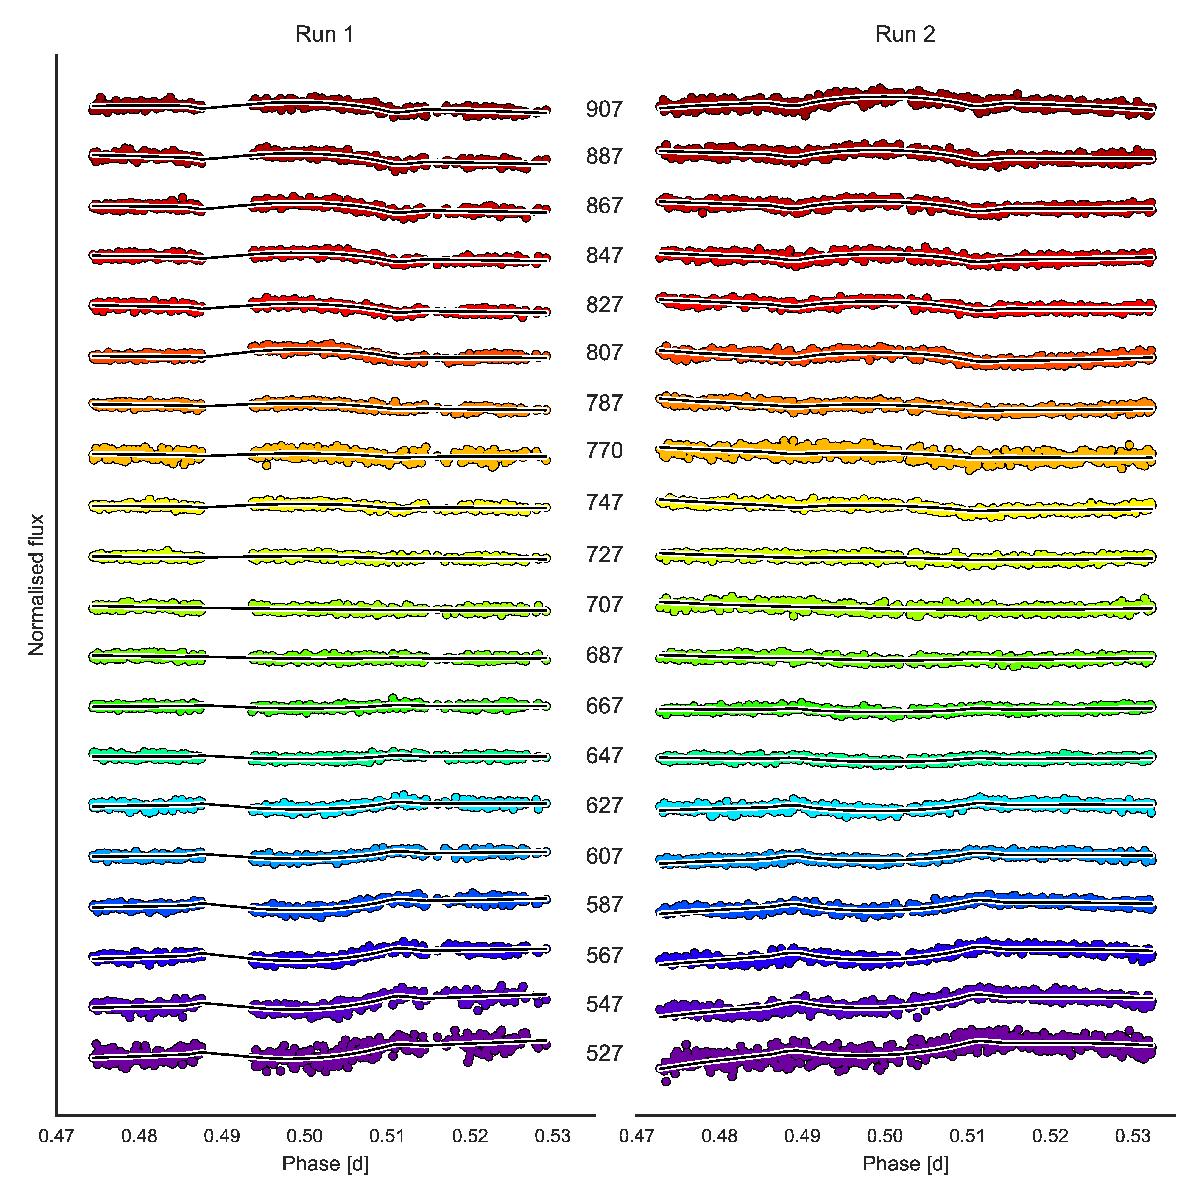
NB light curves for both observing runs and the dwr approach posterior median model (black line) as a function of the phase. Passband centres are marked in nanometres.
Current usage metrics show cumulative count of Article Views (full-text article views including HTML views, PDF and ePub downloads, according to the available data) and Abstracts Views on Vision4Press platform.
Data correspond to usage on the plateform after 2015. The current usage metrics is available 48-96 hours after online publication and is updated daily on week days.
Initial download of the metrics may take a while.