Free Access
Fig. 6
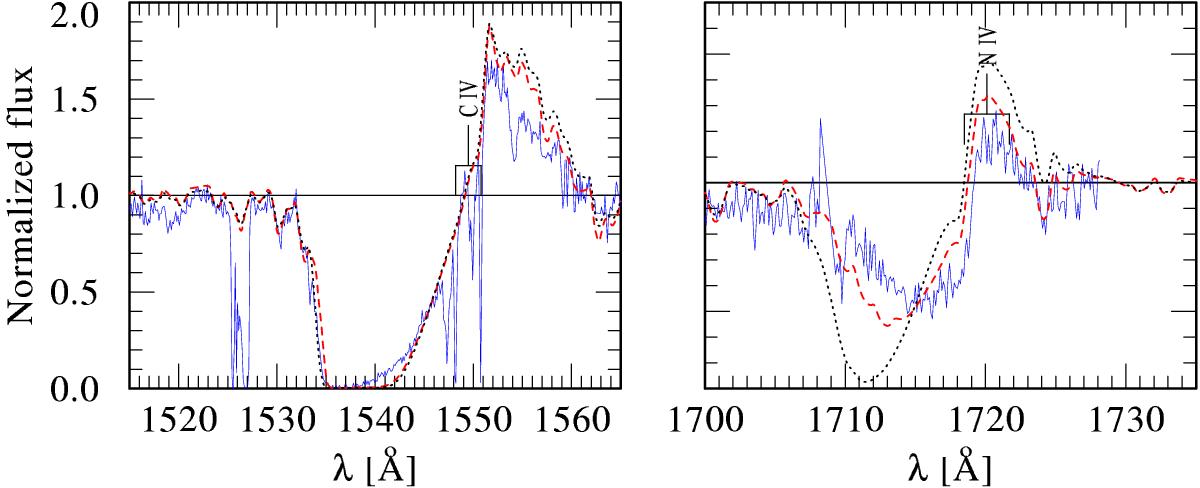
Models with different clumping parameters are compared to the P-Cygni profiles C iv λλ1548–1551 and N iv λ1718 of N206-FS 187 (blue solid line). Dashed lines (red) are for the model with Ṁ = 2.6 × 10⁻⁶M⊙ yr-1, D = 20, and RD = 0.05 R∗. The dotted lines (black) show the model with Ṁ = 1 × 10⁻⁵M⊙ yr-1, D = 10, and RD = 10 R∗.
Current usage metrics show cumulative count of Article Views (full-text article views including HTML views, PDF and ePub downloads, according to the available data) and Abstracts Views on Vision4Press platform.
Data correspond to usage on the plateform after 2015. The current usage metrics is available 48-96 hours after online publication and is updated daily on week days.
Initial download of the metrics may take a while.