Fig. 5
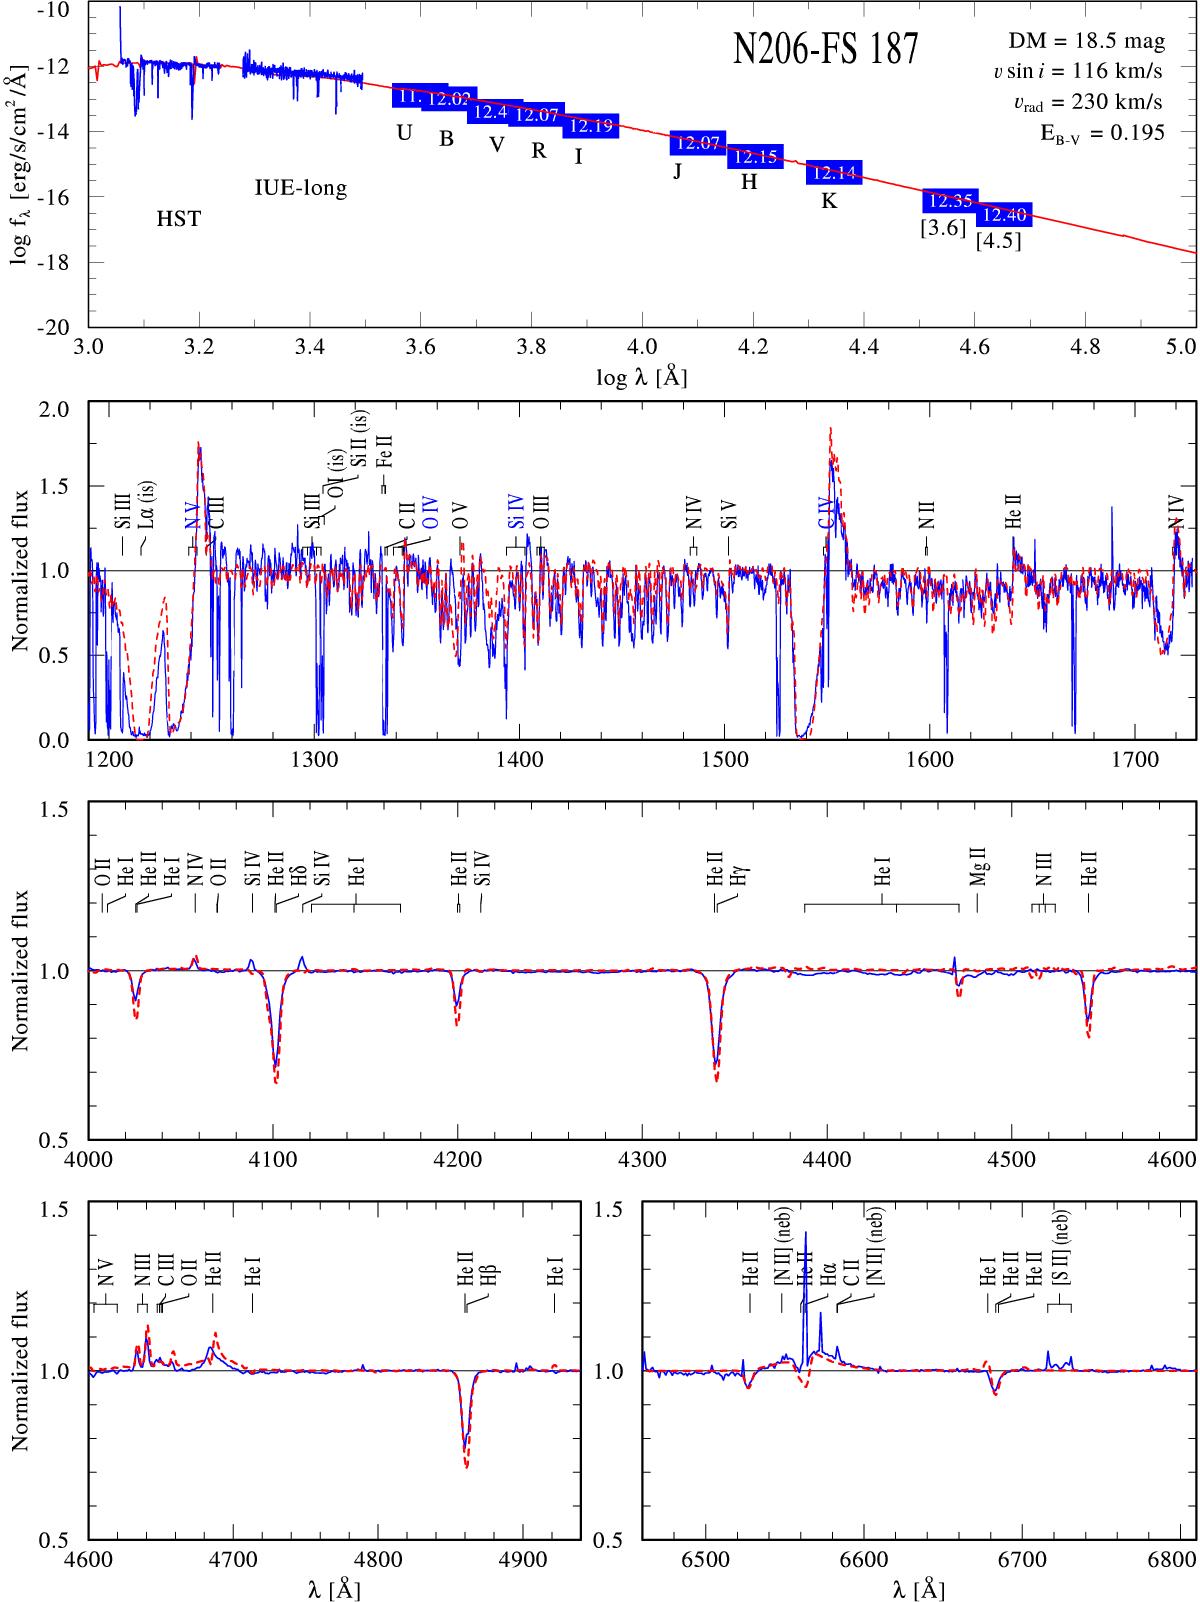
Spectral fit for N206-FS 187. The upper panel shows the model SED (red) fitted to the available photometry from optical (UBV and I) and infrared (JHKs and IRAC 3.6 and 4.5 μm) bands (blue boxes) as well as the calibrated UV spectra from HST and IUE. The lower panels show the normalized HST and VLT-FLAMES spectra (blue solid line), overplotted with the PoWR model (red dashed line). The parameters of this best-fit model are given in Table 3. The observed spectrum also contains nebular emission lines (neb) and interstellar absorption lines (is).
Current usage metrics show cumulative count of Article Views (full-text article views including HTML views, PDF and ePub downloads, according to the available data) and Abstracts Views on Vision4Press platform.
Data correspond to usage on the plateform after 2015. The current usage metrics is available 48-96 hours after online publication and is updated daily on week days.
Initial download of the metrics may take a while.