Fig. 3
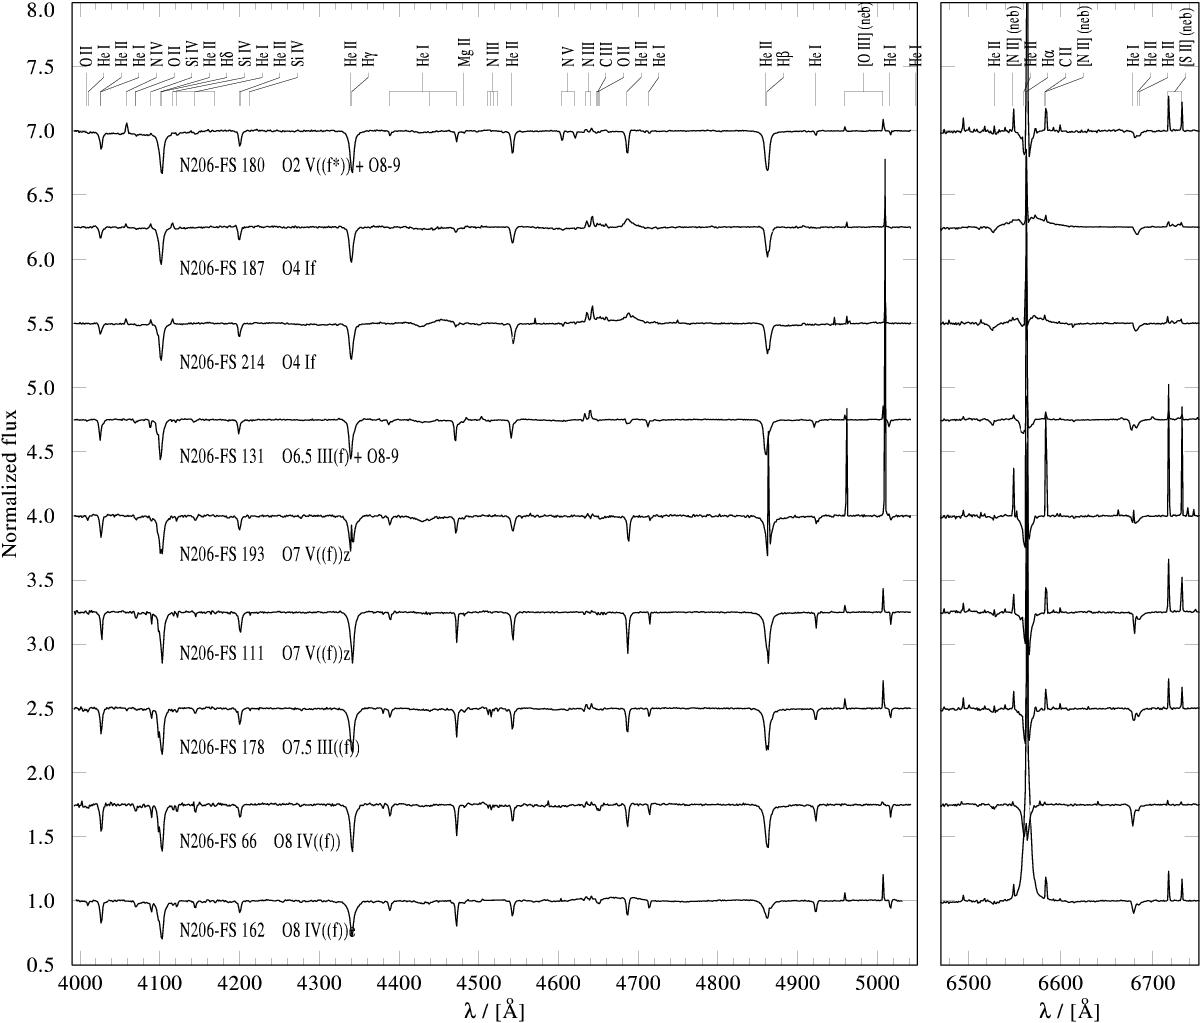
Normalized spectra of the nine Of-type stars. The left panel depicts the medium resolution spectra in the blue (setting: LR02 and LR03). The high resolution spectra in the red (setting: HR15N) are shown in the right panelwhich includes Hα line. The central emission in Hα and the [O iii], [N ii], and [S ii] lines are from nebular emission (neb).
Current usage metrics show cumulative count of Article Views (full-text article views including HTML views, PDF and ePub downloads, according to the available data) and Abstracts Views on Vision4Press platform.
Data correspond to usage on the plateform after 2015. The current usage metrics is available 48-96 hours after online publication and is updated daily on week days.
Initial download of the metrics may take a while.