Fig. 18
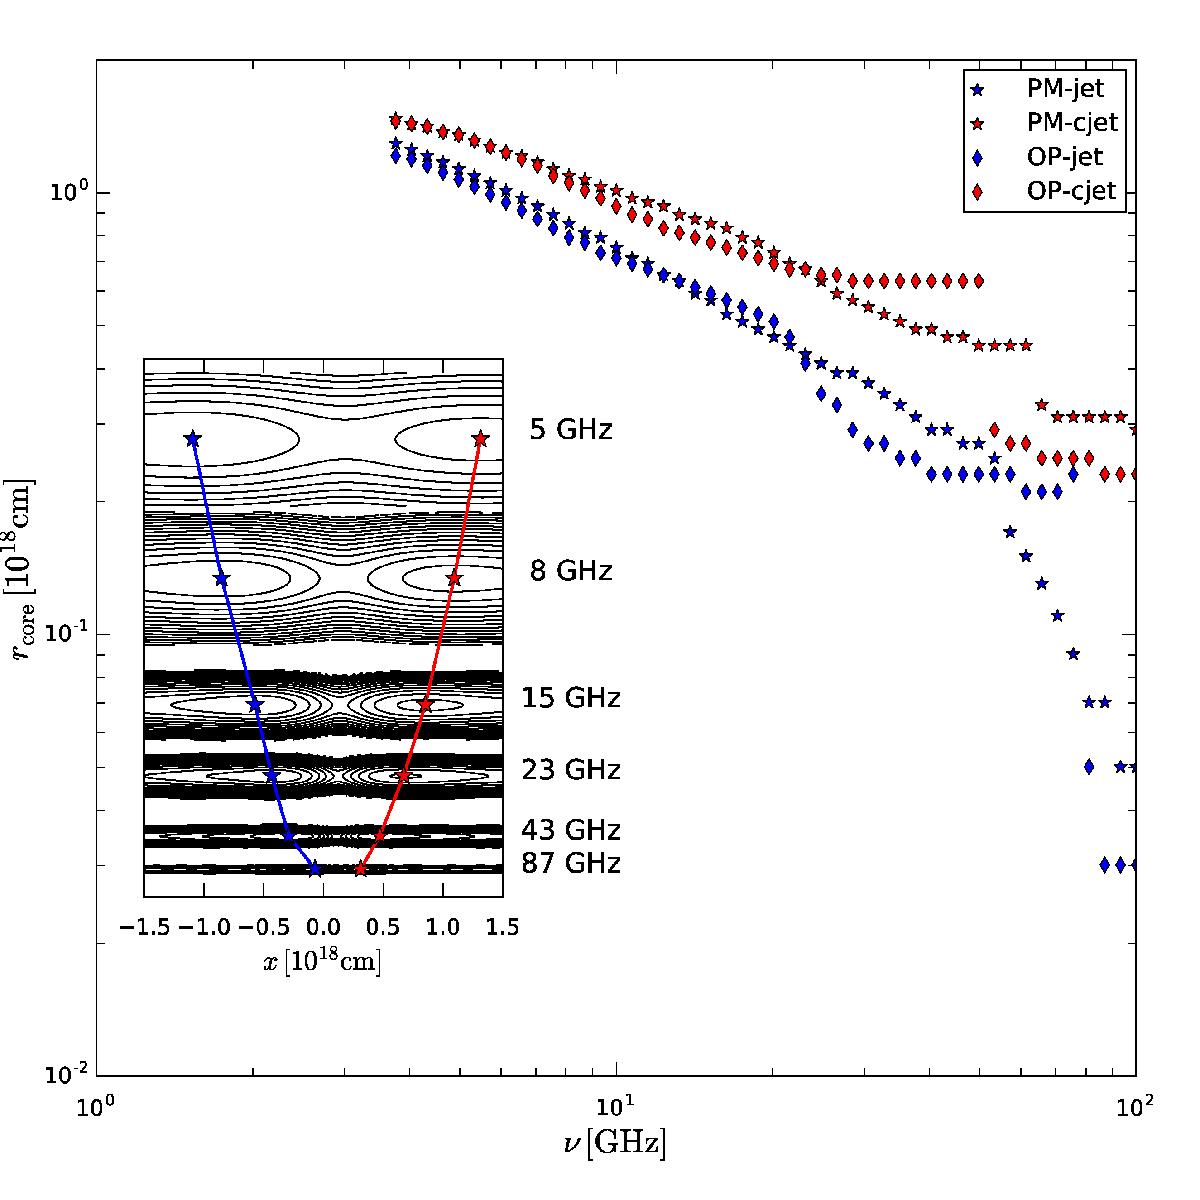
Variation of the core shift with frequency as obtained from our reference model. The inset panel shows a contour plot of the synthetic radio maps over-plotted with corresponding core position for different observing frequencies. In the inset panel the range from −1.5 × 1018 cm < x < 0 cm indicates the jet (pointing towards the observer) and the range from 0 mas < x < 1.5 × 1018 cm corresponds to the counter-jet.
Current usage metrics show cumulative count of Article Views (full-text article views including HTML views, PDF and ePub downloads, according to the available data) and Abstracts Views on Vision4Press platform.
Data correspond to usage on the plateform after 2015. The current usage metrics is available 48-96 hours after online publication and is updated daily on week days.
Initial download of the metrics may take a while.