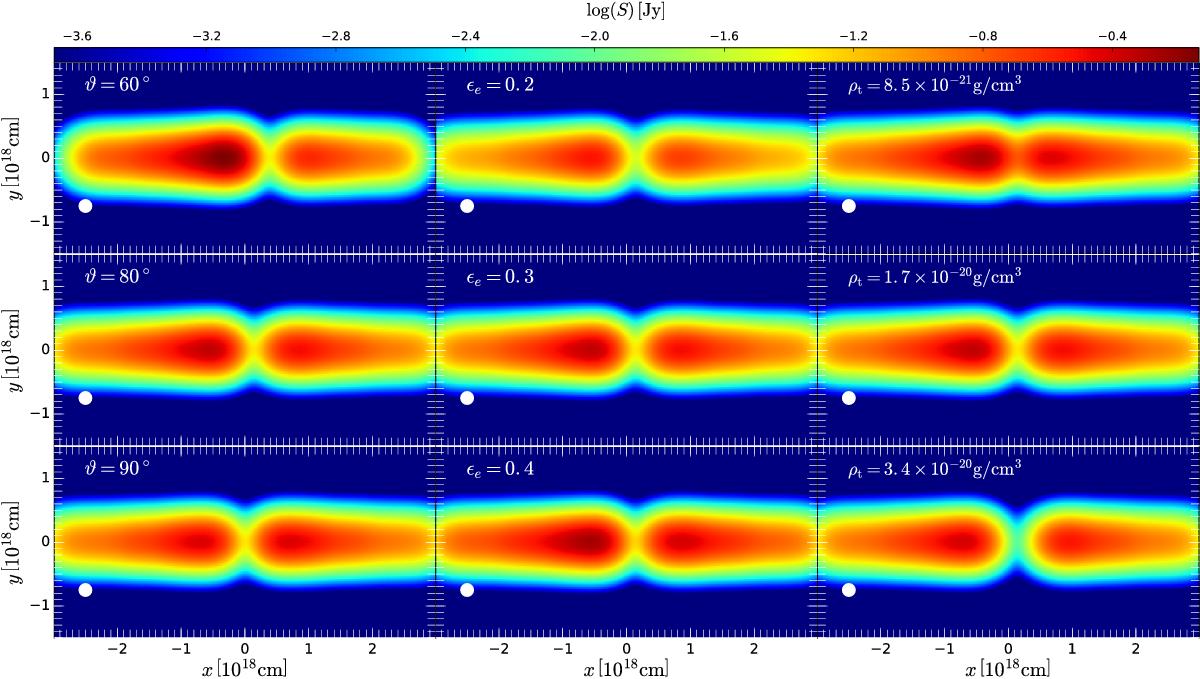
Fig. 15

Influence of the viewing angle (left column), the thermal to non-thermal energy ratio (middle column) and the torus rest-mass density (right column) on the 15 GHz radio maps. In each panel the range from −3 × 1018 cm <x< 0 cm indicates the jet (pointing towards the observer) and the range from 0 mas <x< 3 × 1018 cm corresponds to the counter-jet. The convolving beam is plotted in the bottom left corner of each panel.
Current usage metrics show cumulative count of Article Views (full-text article views including HTML views, PDF and ePub downloads, according to the available data) and Abstracts Views on Vision4Press platform.
Data correspond to usage on the plateform after 2015. The current usage metrics is available 48-96 hours after online publication and is updated daily on week days.
Initial download of the metrics may take a while.


