Fig. 12
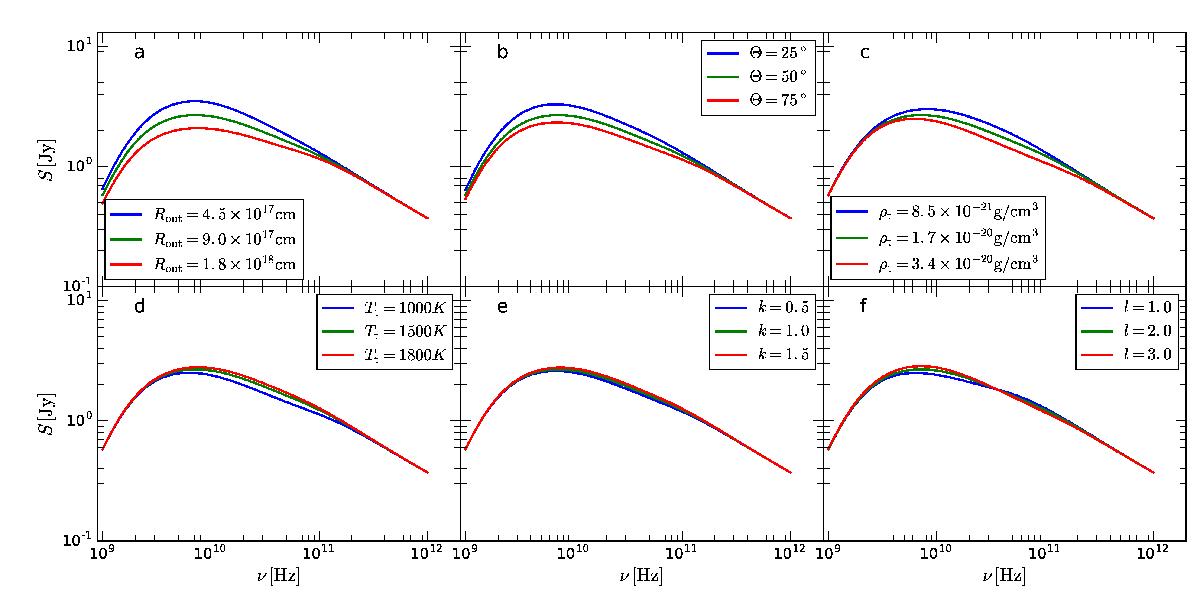
Influence of the torus parameter on the observed single-dish spectrum. Top row from left to right: the torus outer radius, torus thickness, and torus rest-mass density are shown. Bottom row from left to right: the torus temperature, distribution of the torus rest-mass density, and distribution of the torus temperature are shown.
Current usage metrics show cumulative count of Article Views (full-text article views including HTML views, PDF and ePub downloads, according to the available data) and Abstracts Views on Vision4Press platform.
Data correspond to usage on the plateform after 2015. The current usage metrics is available 48-96 hours after online publication and is updated daily on week days.
Initial download of the metrics may take a while.