Fig. 6
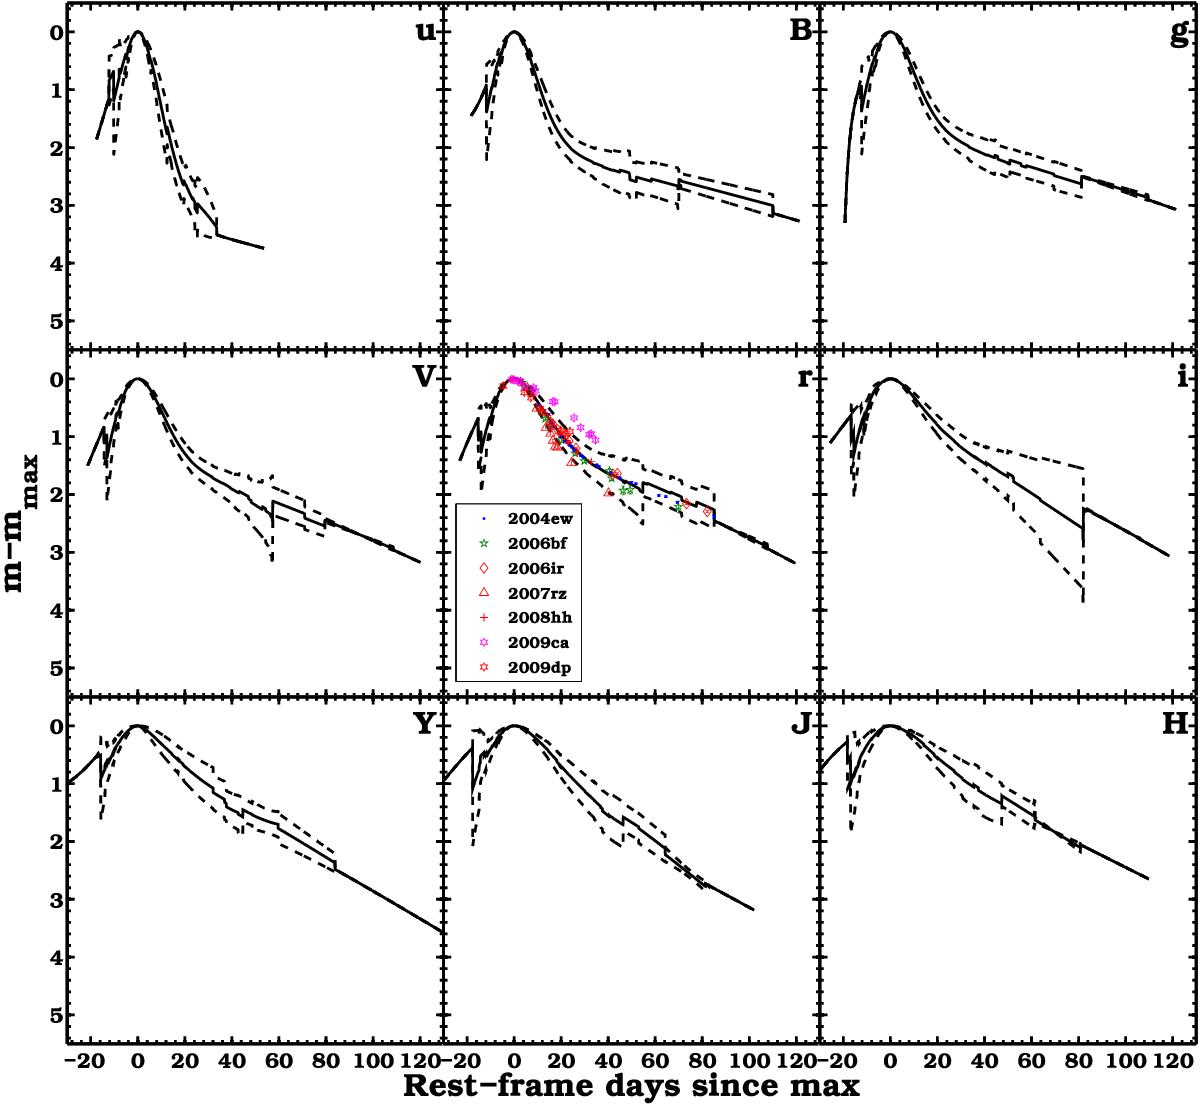
SE SN light-curve templates. The templates were constructed by averaging the light-curve fits plotted in Fig. 2. The templates are represented by solid lines, their uncertainties by dashed lines. The r-band template light curve was used to estimate t(r)max for seven objects having follow-up observations beginning past peak (see central panel). Depending on their subtype, that is, IIb, Ib, Ic, and Ic-BL, these objects are represented in green, blue, red, and magenta, respectively.
Current usage metrics show cumulative count of Article Views (full-text article views including HTML views, PDF and ePub downloads, according to the available data) and Abstracts Views on Vision4Press platform.
Data correspond to usage on the plateform after 2015. The current usage metrics is available 48-96 hours after online publication and is updated daily on week days.
Initial download of the metrics may take a while.